Weekly backtests → w/c 3 August 2026

Week commencing Monday 3 August 2026

Five 09:30 cash-open sessions, each read at both durations Atlas IB offers, a 60-minute window and a 30-minute one. Ten readings in total. Friday was Non-Farm Payrolls.

At a glance

Every window that appeared, in the order the indicator produced them.

5
windows in 🧲 Atlas mode, where one side cleared the 62% threshold
5
windows that abstained, with no side clearing it
4 / 4
Atlas-mode races that resolved, all to the favoured side
1
❌ of the week, on a window that had already abstained
SessionIB rangeBox tag▲▼∅n StateTargetOutcome
60-minute window · 09:30–10:30
Mon 3 Aug371.75⚖️ Normal69%13%19%620🧲 Atlas ▲≈93 pt🧲✅ ~10:51
Tue 4 Aug356.25⚖️ Normal49%11%40%620abstain≈178 pt✅ ~12:47
Wed 5 Aug172.25💰 Accumulation4%25%71%404abstain≈172 pt✅ ~11:57
Thu 6 Aug425.50⚖️ Normal65%18%17%570🧲 Atlas ▲≈106 pt∅ neither
Fri 7 Aug · NFP257.50💰 Accumulation19%14%67%470abstain≈258 pt∅ neither
30-minute window · 09:30–10:00
Mon 3 Aug316.25⚖️ Normal80%14%6%635🧲 Atlas ▲≈79 pt🧲✅ ~10:36
Tue 4 Aug296.50⚖️ Normal73%22%5%552🧲 Atlas ▲≈74 pt🧲✅ ~10:38
Wed 5 Aug163.75💰 Accumulation34%18%48%562abstain≈164 pt❌ ~11:56
Thu 6 Aug310.00⚖️ Normal80%14%6%635🧲 Atlas ▲≈78 pt🧲✅ ~10:17
Fri 7 Aug · NFP177.50💰 Accumulation14%38%47%460abstain≈178 pt∅ neither

▲ / ▼ / ∅ are the measured shares of comparable historical windows in which the upper target was reached first, the lower target was reached first, or neither was reached by the session close; n is how many such windows sit behind them. Target distances are the multiple the indicator's Auto setting chose × the window's range, read from the chart geometry. The one capture here that includes the indicator's status table, Friday's 30-minute window, states its own directly, ▼ 177.5 pt on a ×1 auto multiple, and it matches. Outcome times are New York time, taken from the position of the outcome mark on the chart, to within a minute or two.

None of this week was in the sample. The tables Atlas IB reads were measured on NQ history ending 27 July 2026. Every session below happened afterwards. The percentages on these charts are fixed lookups, and the chart engine performs no estimation, so the figures shown here are exactly what a live user saw a few minutes after each window closed.
Window one

The 60-minute window · 09:30–10:30

The longer window waits for the whole first hour to complete before it commits. It gets a bigger, better-defined range to work from and, usually, a target that sits further away in points.
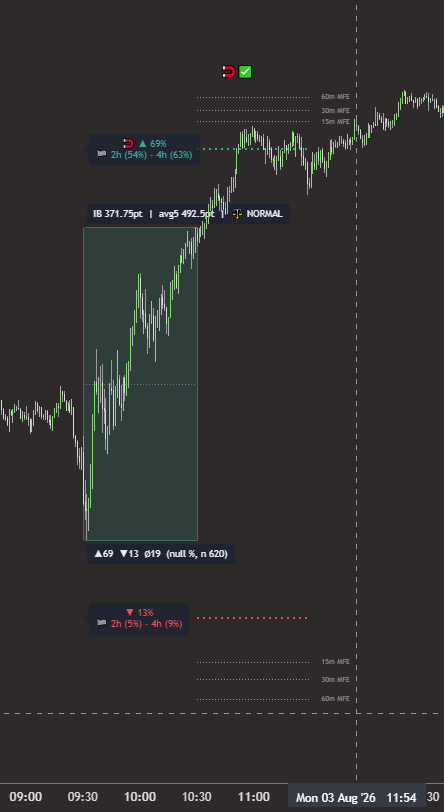
Monday 3 August 2026, 09:30 60-minute Initial Balance on NQ: box tinted to the upside, upper rail badge reading 69% with a magnet, lower rail 13%, and a magnet-plus-tick outcome mark printed just before 11:00.
Mon 3 Aug 2026 · 09:30 +60m · NQ 1-minute
Monday 3 August

A clean Atlas-mode morning

🧲✅ favoured side reached first · ~10:51
  • IB range371.75 pt · avg5 492.50 · ⚖️ Normal
  • Split▲ 69% · ▼ 13% · ∅ 19% (n 620)
  • Shorter horizons▲ 2h 54% · 4h 63%
  • Target distance≈93 pt (0.25 × range)

The window opened with a sharp drop and spent the hour climbing out of it, closing at the top of its own range. Comparable windows went on to reach the upper target first 69% of the time, clear of the 62% threshold, so the box tints, the upper rail takes the magnet and the morning is in Atlas mode.

Price left the box on the upside almost immediately and tagged the target at about 10:51, twenty minutes after the window closed. The table had said 54% of comparable windows resolved that way inside two hours; this one took twenty-one minutes.
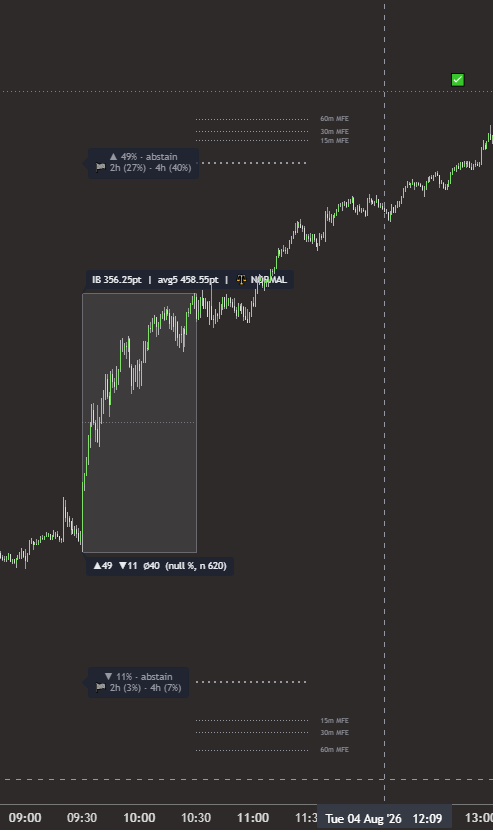
Tuesday 4 August 2026, 09:30 60-minute Initial Balance on NQ: both rails grey and labelled abstain at 49% and 11%, with a plain green tick printed in the early afternoon.
Tue 4 Aug 2026 · 09:30 +60m · NQ 1-minute
Tuesday 4 August

Abstain, and the abstain was the useful part

✅ larger share correct · ~12:47
  • IB range356.25 pt · avg5 458.55 · ⚖️ Normal
  • Split▲ 49% · ▼ 11% · ∅ 40% (n 620)
  • Shorter horizons▲ 2h 27% · 4h 40%
  • Target distance≈178 pt (0.5 × range)

A visually similar morning to Monday, an upward hour closing near its high, but the numbers are not similar at all. The upside gets 49%, well short of the threshold, and the largest single share on the chart belongs to ∅ 40%: neither target reached at all. Both rails stay grey and the badge says abstain.

The upside did eventually win the race, at about 12:47, more than two hours after the window closed. That is the shape the shorter-horizon figures were describing before it happened: only 27% of comparable windows resolved up inside two hours, rising to 40% by four. A lean you have to wait two and a quarter hours for is a different trade from Monday's, and the chart said so at 10:30.
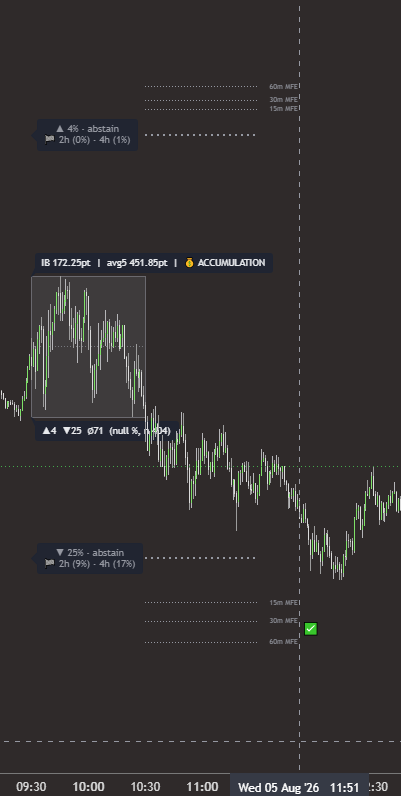
Wednesday 5 August 2026, 09:30 60-minute Initial Balance on NQ: a narrow accumulation box, both rails grey and labelled abstain at 4% and 25%, with a green tick printed below the lower rail around midday.
Wed 5 Aug 2026 · 09:30 +60m · NQ 1-minute
Wednesday 5 August

The quietest hour of the week

✅ larger share correct · ~11:57
  • IB range172.25 pt · avg5 451.85 · 💰 Accumulation
  • Split▲ 4% · ▼ 25% · ∅ 71% (n 404)
  • Shorter horizons▼ 2h 9% · 4h 17%
  • Target distance≈172 pt (1.0 × range)

172 points against a five-session average of 452, roughly a third of recent behaviour, which is what earns the 💰 ACCUMULATION tag. Price spent the hour rolling over inside the box and closed the window on its low.

Note what the compression does to the geometry: because the window is small, the automatic ladder widens the multiple to 1.0 × the range, so the target still sits 172 points away, and ∅ jumps to 71%. The single most likely outcome, by a distance, was that neither target would be reached at all. The downside got there in the end, at about 11:57, and because 25% was the larger of the two shares the mark prints as a tick, but it prints without a magnet, because this window never offered a lean worth the name.
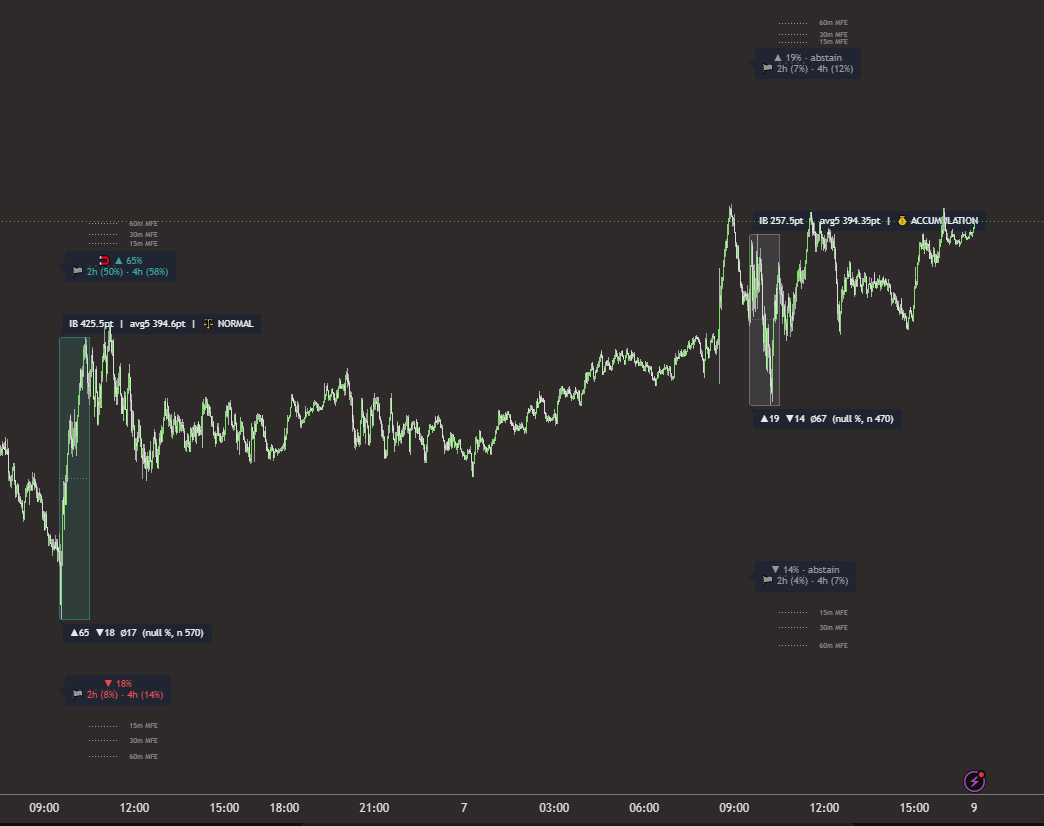
Thursday 6 and Friday 7 August 2026 on one NQ chart: Thursday's 60-minute Initial Balance in Atlas mode with a 65% upper rail that price never reaches during the session, then the overnight run and Friday's narrow accumulation window with both rails grey and labelled abstain.
Thu 6 – Fri 7 Aug 2026 · 09:30 +60m, both sessions on one chart · NQ 1-minute
Thursday 6 & Friday 7 August

The week's most instructive pair: a lean that was right about direction and wrong about reach

∅ neither target reached, both sessions
  • Thu · IB range425.50 pt · avg5 394.60 · ⚖️ Normal
  • Thu · Split▲ 65% · ▼ 18% · ∅ 17% (n 570)
  • Thu · Horizons▲ 2h 50% · 4h 58%
  • Thu · Target≈106 pt (0.25 × range)
  • Fri · IB range257.50 pt · avg5 394.35 · 💰 Accumulation
  • Fri · Split▲ 19% · ▼ 14% · ∅ 67% (n 470)
  • Fri · Horizons▲ 2h 7% · 4h 12%
  • Fri · Target≈258 pt (1.0 × range)

Thursday produced the week's widest window at 425.50 points and a genuine Atlas-mode lean: ▲ 65%, magnet on the upper rail, target 106 points above the window's high. Worth noticing that the two range tags disagree here: against the last five sessions this hour reads ⚖️ NORMAL, but against seventeen years it is large enough to count as expanded, which is why the automatic ladder chose the narrowest multiple it has, 0.25 ×, rather than widening the target further.

It still was not enough. For the rest of the session price never traded more than about thirty-five points above the window's high. Neither rail was reached, the race closed unresolved at the session boundary, and no outcome mark prints. This is the ∅ 17% branch of the split, the least likely of the three, and it happened.

Then it went. Follow the chart across the overnight session: price grinds higher through the evening and Asia, and at 08:38 on Friday, eight minutes after the payrolls release, it trades clean through the level Thursday's rail had been sitting at. Directionally the 65% was right. It was right roughly twenty-two hours late, which for a window whose race is scored to the session close is the same thing as being wrong. That gap is exactly what the ∅ column is there to warn you about.

Thursday was also the session before Non-Farm Payrolls, and the desk convention that pre-payrolls tape stalls (that price is reluctant to commit to a direction until the number is out) is widely held. We have not measured that as part of the Atlas tables, so treat it as context rather than a statistic; but it is a reasonable description of a session that leaned up, went nowhere, and then moved the moment the release cleared.

Friday, the payrolls session itself, is the mirror image. The move happened at 08:30, an hour before the window even opened; by 09:30 the tape had already spent itself, and the cash-open hour printed just 257.50 points against a 394-point five-session average, 💰 ACCUMULATION. The split is flat and weak in both directions, ▲ 19% against ▼ 14%, so both rails go grey: abstain. And ∅ 67%, two thirds of comparable windows reached neither target. Neither target was reached. The single most likely outcome on the chart was "nothing happens here", and nothing happened here.
Window two

The 30-minute window · 09:30–10:00

The same five mornings, read from the first half hour instead of the first hour. Shorter window, smaller range, nearer target and, this week, a materially different picture on two of the five days.

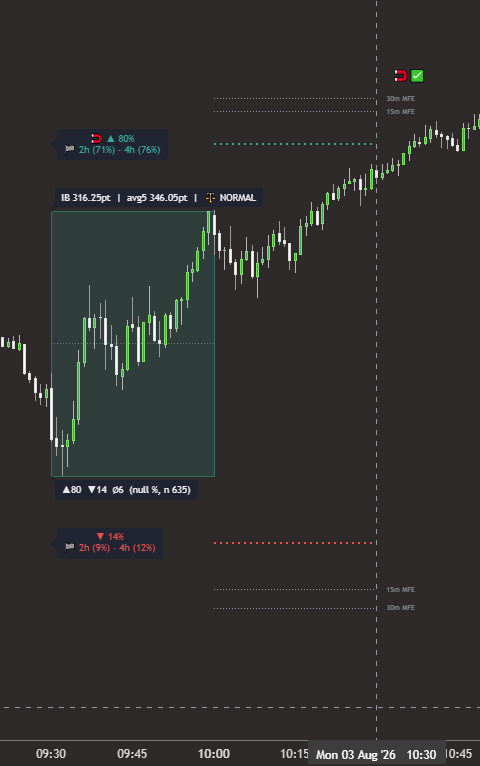
Monday 3 August 2026, 09:30 30-minute Initial Balance on NQ: box tinted upward, upper rail badge 80% with a magnet, lower rail 14%, magnet-and-tick outcome mark printed before 10:45.
Mon 3 Aug 2026 · 09:30 +30m · NQ 1-minute
Monday 3 August

Same call as the hour, made half an hour earlier

🧲✅ favoured side reached first · ~10:36
  • IB range316.25 pt · avg5 346.05 · ⚖️ Normal
  • Split▲ 80% · ▼ 14% · ∅ 6% (n 635)
  • Shorter horizons▲ 2h 71% · 4h 76%
  • Target distance≈79 pt (0.25 × range)

The strongest reading of the week: 80% up-first, with only 6% of comparable windows failing to reach either target. Both figures follow from the same fact, a nearer target is reached more often, so the shorter window's numbers are naturally more decisive than the hour's, not more confident.

Price cleared the target at about 10:36. The 60-minute read on the same morning agreed on direction and got there fifteen minutes later, at a target fourteen points further out.

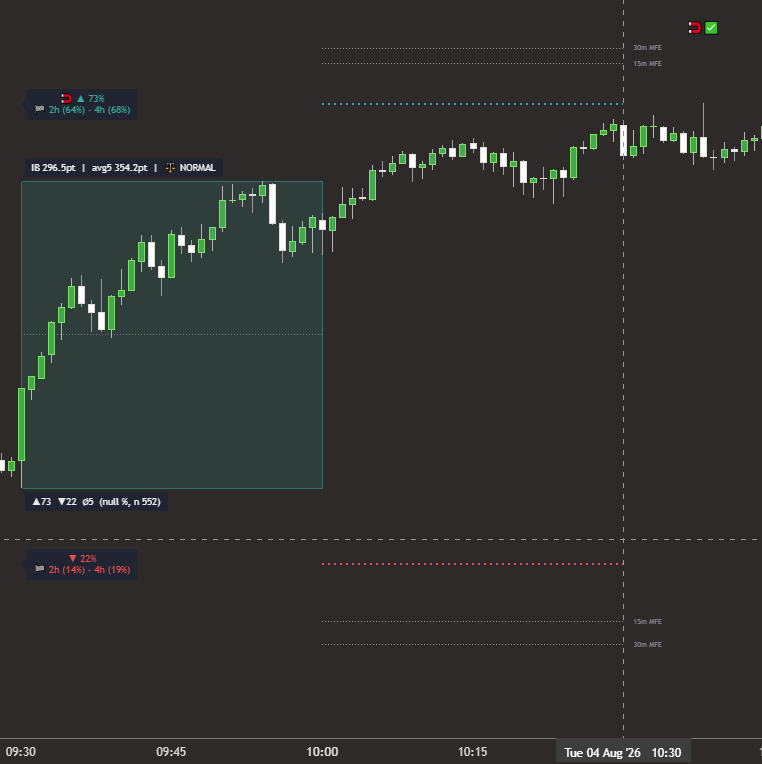
Tuesday 4 August 2026, 09:30 30-minute Initial Balance on NQ: box tinted upward, upper rail 73% with a magnet, lower rail 22%, magnet-and-tick mark printed just after 10:30.
Tue 4 Aug 2026 · 09:30 +30m · NQ 1-minute
Tuesday 4 August

The day the two windows disagreed

🧲✅ favoured side reached first · ~10:38
  • IB range296.50 pt · avg5 354.20 · ⚖️ Normal
  • Split▲ 73% · ▼ 22% · ∅ 5% (n 552)
  • Shorter horizons▲ 2h 64% · 4h 68%
  • Target distance≈74 pt (0.25 × range)

This is the clearest contrast of the week. The 60-minute read of this same morning abstained at 49% with a 178-point target and 40% odds of reaching nothing. The 30-minute read is in Atlas mode at 73%, with a target less than half as far away and only 5% chance of no resolution at all.

Both were right about direction. Only one of them offered a lean you could act on, and the difference between them is almost entirely how far the target sat, not how confident the indicator was. Price reached the 30-minute target at about 10:38, two hours before the 60-minute one. Same morning, same move, two very different trades.

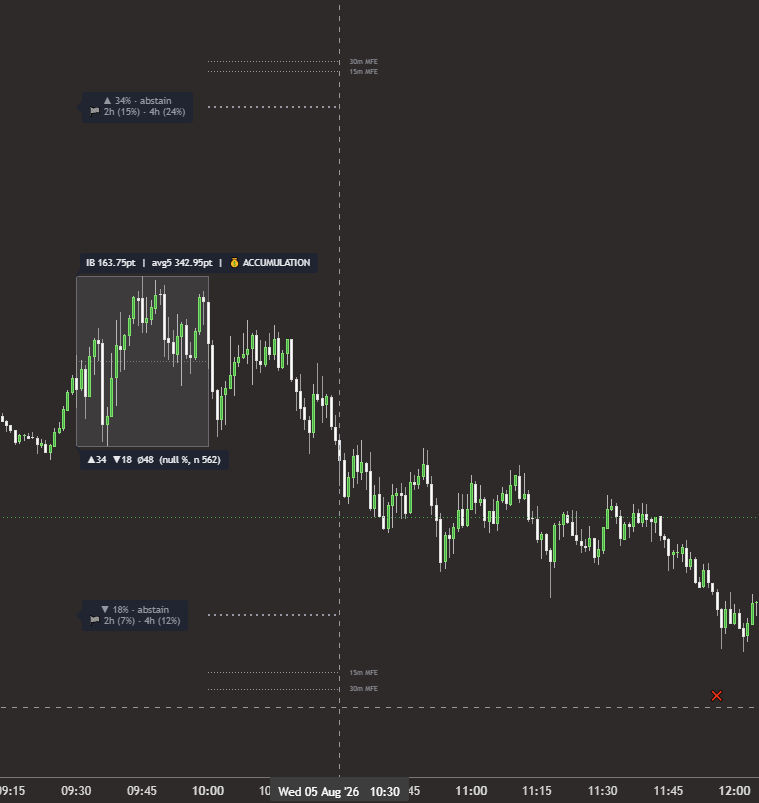
Wednesday 5 August 2026, 09:30 30-minute Initial Balance on NQ: a narrow grey accumulation box, both rails grey and labelled abstain at 34% and 18%, and a red cross printed below the lower rail just before midday.
Wed 5 Aug 2026 · 09:30 +30m · NQ 1-minute
Wednesday 5 August

The red mark of the week

❌ the other side got there first · ~11:56
  • IB range163.75 pt · avg5 342.95 · 💰 Accumulation
  • Split▲ 34% · ▼ 18% · ∅ 48% (n 562)
  • Shorter horizons▲ 2h 15% · 4h 24%
  • Target distance≈164 pt (1.0 × range)

Under half the recent average range, another compressed window, another 1.0 × multiple, another very large ∅ 48%. Neither side is anywhere near the threshold, so both rails are grey: abstain. Of the two weak shares, the upside is the larger at 34%.

Price went the other way, and the lower target was taken at about 11:56. Because the larger share was the upside, the mark prints red: ❌. It prints without a magnet, which is the part that matters: the indicator had already declined to lean on this window, so this is not a failed signal, it is the chart honestly scoring the larger of two numbers that were both weak. This is the only red mark of the week and it landed exactly where the indicator said it had nothing to offer.

Worth putting beside the 60-minute read of the same morning, which had the downside as its larger share and therefore scored the very same downward move as a tick. Two windows, one move, opposite grades, because they are genuinely separate measurements, not two views of one signal.

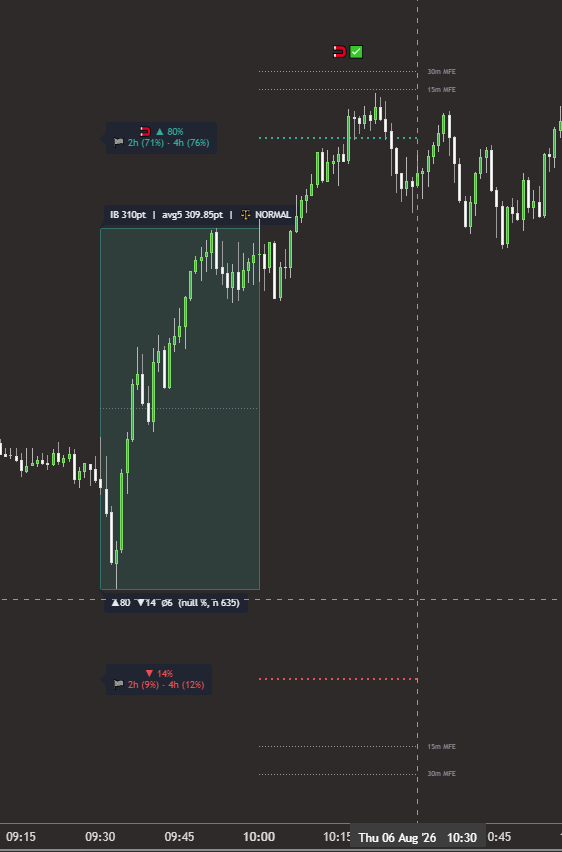
Thursday 6 August 2026, 09:30 30-minute Initial Balance on NQ: box tinted upward, upper rail 80% with a magnet, lower rail 14%, magnet-and-tick mark printed shortly after 10:15.
Thu 6 Aug 2026 · 09:30 +30m · NQ 1-minute
Thursday 6 August

The near target hit; the far one, on the same morning, never did

🧲✅ favoured side reached first · ~10:17
  • IB range310.00 pt · avg5 309.85 · ⚖️ Normal
  • Split▲ 80% · ▼ 14% · ∅ 6% (n 635)
  • Shorter horizons▲ 2h 71% · 4h 76%
  • Target distance≈78 pt (0.25 × range)

The most useful single comparison on this page. Both windows read Thursday the same way, up, and both were in Atlas mode. The 30-minute target sat about 78 points above the half hour's high and was reached at 10:17, seventeen minutes after the window closed. The 60-minute target sat about 106 points above the hour's high and was never reached at all.

The gap between them is wider than those two numbers suggest. Both windows made their low inside the first four minutes and then climbed, so the extra 115 points of range the hour picked up over the half hour were all added at the top. Its target was therefore not twenty-eight points further out. It was roughly 140 points higher up the chart. Same morning, same direction, same indicator: one destination was in reach and the other was not.

That is the mechanism the ∅ column exists to price, and it is why the target-distance row deserves as much attention as the percentage beside it.

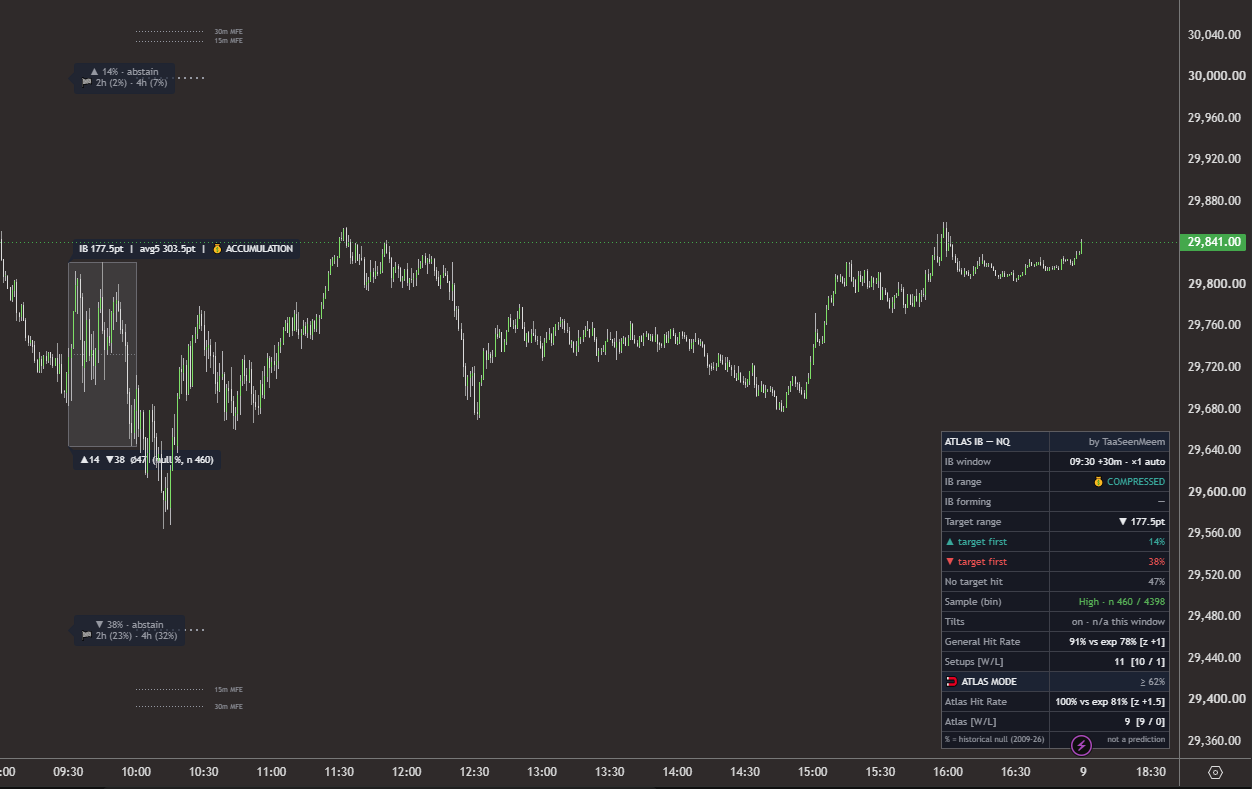
Friday 7 August 2026 payrolls session on NQ, whole session from 09:00 to the close: a narrow grey accumulation box at 09:30, both rails grey and labelled abstain at 14% and 38%, no outcome mark anywhere on the chart, and the indicator's status table in the lower right.
Fri 7 Aug 2026 · 09:30 +30m · NQ 1-minute · the whole session, 09:00 through to the close
Friday 7 August · NFP

Payrolls day: no lean offered, in either direction

∅ neither target reached, the largest of the three shares
  • IB range177.50 pt · avg5 303.50 · 💰 Accumulation
  • Split▲ 14% · ▼ 38% · ∅ 47% (n 460)
  • Shorter horizons▼ 2h 23% · 4h 32%
  • Target distance≈178 pt (1.0 × range)

The 30-minute window leans down where the 60-minute window leaned mildly up (▼ 38% here against ▲ 19% there), but the distinction is academic, because neither is remotely close to the 62% threshold and both windows abstain. The honest summary of the payrolls open at both durations is the same: no directional information here.

The capture above is the entire session, 09:00 through to the close, and there is no outcome mark anywhere on it. Neither target was reached. With the target a full range away at 177.5 points and ∅ 47%, the largest of the three shares and bigger than either direction, that was the table's own most likely answer, and it is the one that came in. No mark prints on a window that never resolves: the absence is the result.

Both durations abstained on payrolls day and both finished the same way. The 09:30 open on the biggest scheduled news day of the month offered no directional information at either window length, and then went nowhere either target could see, which is a more useful thing for an indicator to tell you at 10:00 than a lean it does not have.

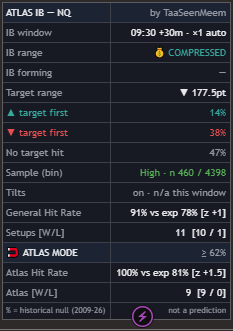
Atlas IB status table for the Friday 30-minute window: IB window 09:30 +30m ×1 auto; IB range COMPRESSED; target range 177.5 points to the downside; up target first 14%, down target first 38%, no target hit 47%; sample High, n 460 of 4398; General Hit Rate 91% versus expected 78% with z plus 1 on 11 setups, 10 wins 1 loss; Atlas mode threshold 62%, Atlas Hit Rate 100% versus expected 81% with z plus 1.5, 9 wins 0 losses.
The status table from the chart above, at full size.

This is also the only capture on this page with the status table in frame, and it is worth reading. The top block states the geometry outright: 09:30 +30m, ×1 auto, target range ▼ 177.5 pt, which is the same figure quoted throughout this page, there derived from the chart's own proportions. Beneath the three outcome shares sits the sample tag: High, n 460 of 4,398.

The bottom two blocks are the indicator marking its own work on whatever history the chart has loaded, more sessions than the week reviewed here, so don't read those counts as this week's. They show General Hit Rate 91% against an expected 78% over eleven decided races, and, restricted to Atlas-mode windows, 100% against an expected 81% over nine.

A 100% row is precisely the sort of number that ought to make you suspicious, so read the bracket next to it: z +1.5. That sits comfortably inside ordinary noise: nine from nine at an 81% base rate turns up roughly one time in seven by chance alone. It is not evidence of anything yet, and we would rather say so than quote it at you. The number worth following is not the hit rate by itself but whether realised and expected stay close as the count grows, which is why the indicator always prints the two together, with the z-score beside them and "not a prediction" along the bottom.

What this week actually shows

Four things, none of which require the week to have gone well.

  1. Distance decides more than direction. The clearest result of the week is Thursday, where both windows leaned up and both were right about the move, and only the one with the nearer target got paid. The half hour's destination was reached seventeen minutes after its window closed; the hour's, some 140 points higher up, was never reached at all. Read the target distance before you read the percentage.
  2. The abstains did their job. Five of ten windows declined to lean, and they clustered where you would want them to: two compressed accumulation mornings and the payrolls session at both durations. The week's only ❌ came on an abstained window, which is precisely where a wrong call costs nothing, because no call was offered. And the payrolls open reached neither target at either duration, which is precisely what each of those two tables had made its single most likely outcome, at 67% and 47%.
  3. Two windows are two measurements, not two opinions. Tuesday and Wednesday both show the durations disagreeing, on Tuesday about whether there was a lean at all, on Wednesday about which side was leaning, to the point where one move scored a tick on the hour and a cross on the half hour. Neither window is the true one. Choose the one that matches how you trade and read it consistently.
  4. A good week is still one week. Four Atlas-mode races resolved and four went to the favoured side. On tables that put those windows in the 65–80% band, four from four is a perfectly ordinary outcome, and so would three from four have been. Ten windows cannot confirm or refute a frequency measured over hundreds. What they can do is accumulate, in public, which is the point of publishing them.
How to check this yourself. Nothing here needs to be taken on trust. Load Atlas IB on your own NQ chart, set the window to 09:30 and the duration to 60 or 30 minutes, and scroll back to the week of 3 August 2026. The same figures will be on your screen, because they are fixed table lookups rather than anything computed from what happened next. The indicator's own General Hit Rate and Atlas Hit Rate rows will then keep score against expectation on however much history you have loaded, which is a far better test than any one week we could publish.