Five 09:30 cash-open sessions, each read at both durations Atlas IB offers, a 60-minute window and a 30-minute one. Ten readings in total. Seven of them declined to lean, which makes this a more useful week to publish than an easy one.
Every window that appeared, in the order the indicator produced them.
| Session | IB range | Box tag | ▲ | ▼ | ∅ | n | State | Target (auto) | Outcome |
|---|---|---|---|---|---|---|---|---|---|
| 60-minute window · 09:30 to 10:30 | |||||||||
| Mon 10 Aug | 181.00 | 💰 Accumulation | 19% | 14% | 67% | 470 | abstain | ▲ 181 pt (×1) | ∅ neither |
| Tue 11 Aug | 206.75 | ⚖️ Normal | 20% | 14% | 66% | 369 | abstain | ▲ 206.8 pt (×1) | ∅ neither |
| Wed 12 Aug | 153.25 | 💰 Accumulation | 14% | 19% | 67% | 376 | abstain | ▼ 153.3 pt (×1) | ∅ neither |
| Thu 13 Aug | 375.00 | 🚀 Expansion | 69% | 13% | 19% | 620 | 🧲 Atlas ▲ | ▲ 93.8 pt (×0.25) | ∅ neither |
| Fri 14 Aug | 146.50 | 💰 Accumulation | 6% | 24% | 70% | 435 | abstain | ▼ 146.5 pt (×1) | ∅ neither |
| 30-minute window · 09:30 to 10:00 | |||||||||
| Mon 10 Aug | 122.25 | 💰 Accumulation | 35% | 21% | 44% | 459 | 🧲 Atlas ▲ | ▲ 122.3 pt (×1) | ∅ neither |
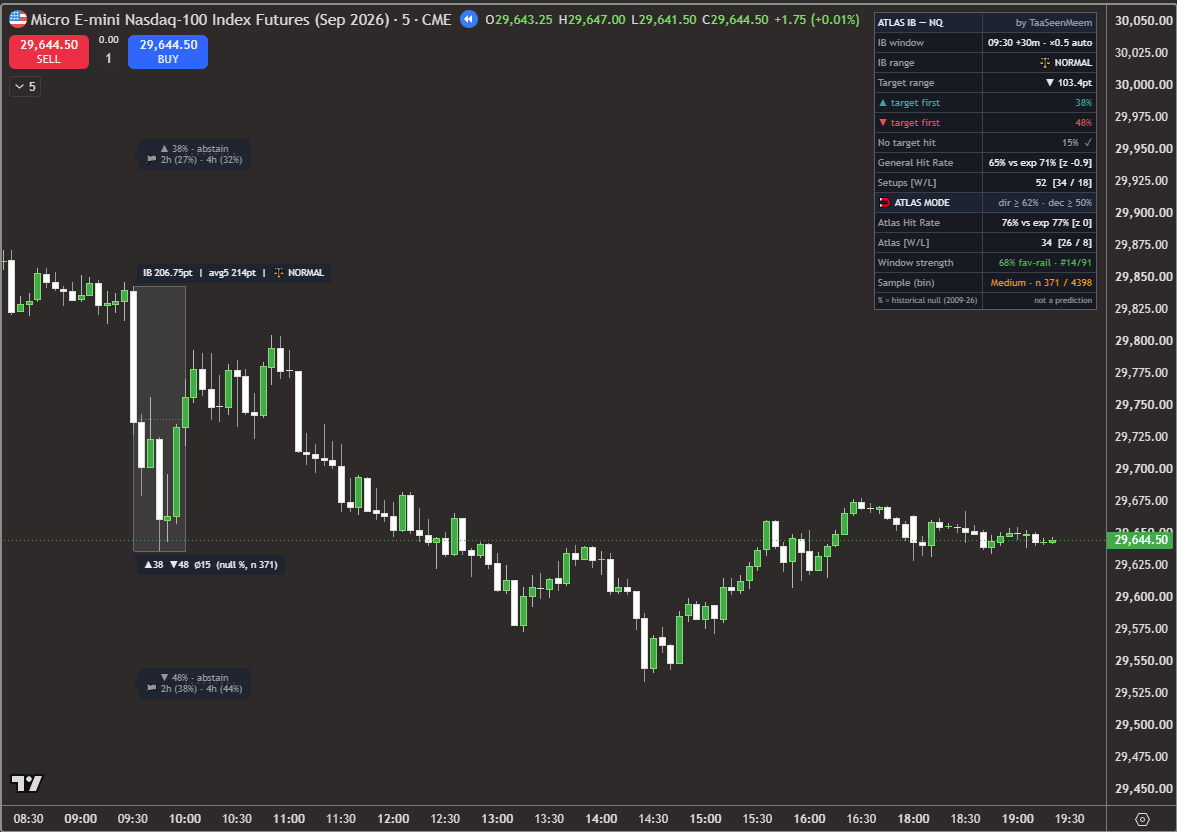
| Tue 11 Aug | 206.75 | ⚖️ Normal | 38% | 48% | 15% | 371 | abstain | ▼ 103.4 pt (×0.5) | ∅ neither |
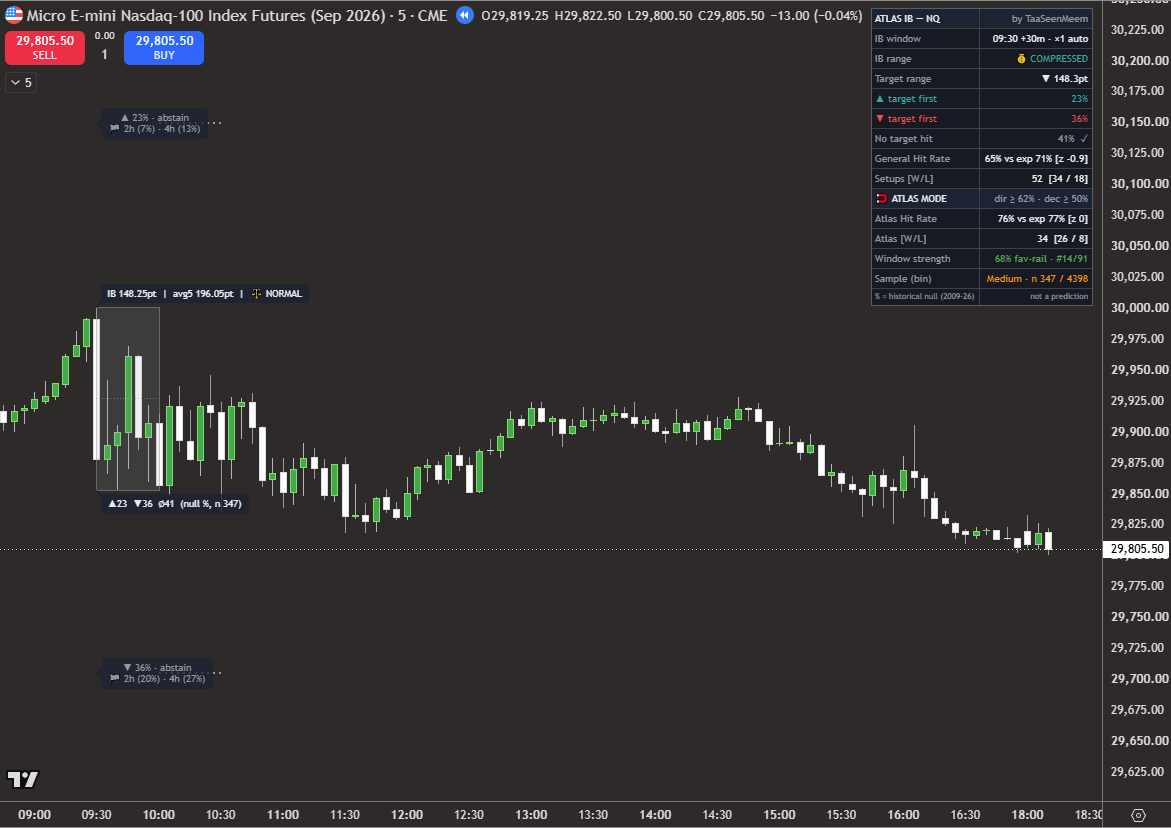
| Wed 12 Aug | 148.25 | ⚖️ Normal | 23% | 36% | 41% | 347 | abstain | ▼ 148.3 pt (×1) | ∅ neither |
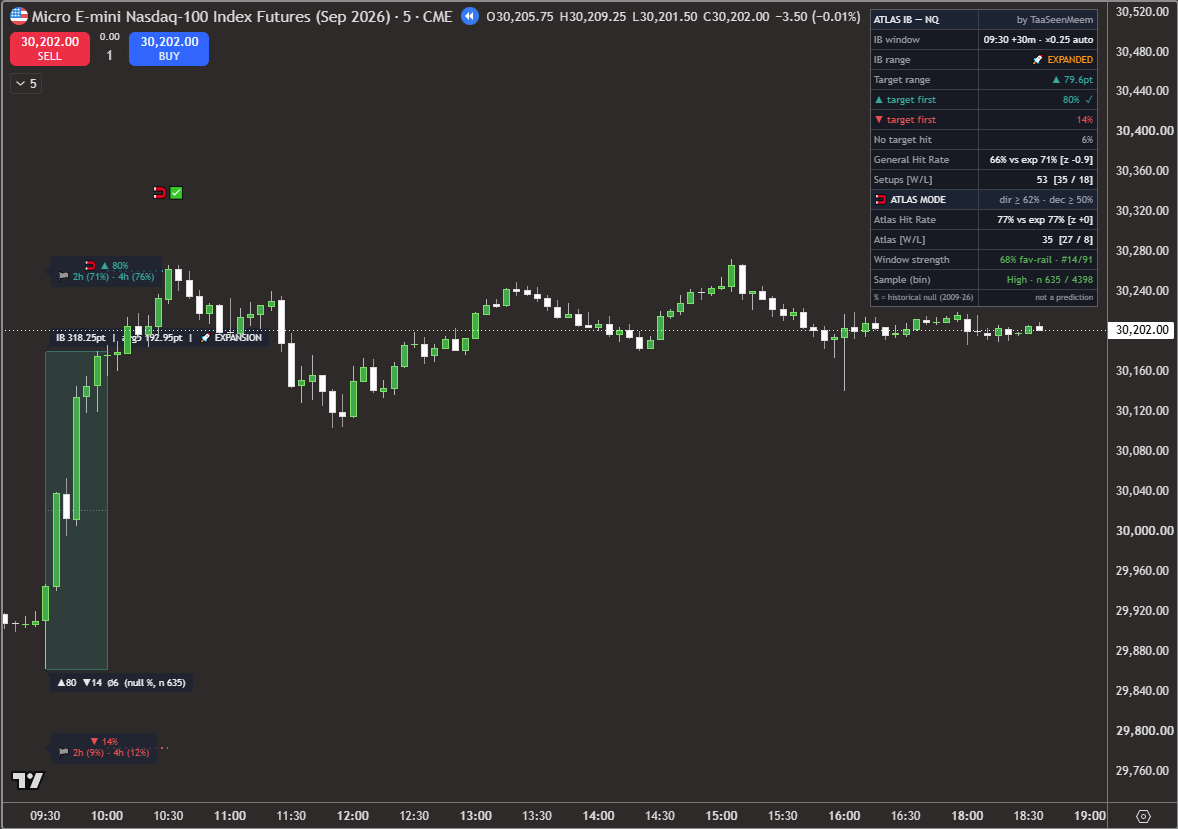
| Thu 13 Aug | 318.25 | 🚀 Expansion | 80% | 14% | 6% | 635 | 🧲 Atlas ▲ | ▲ 79.6 pt (×0.25) | 🧲✅ ~10:30 |
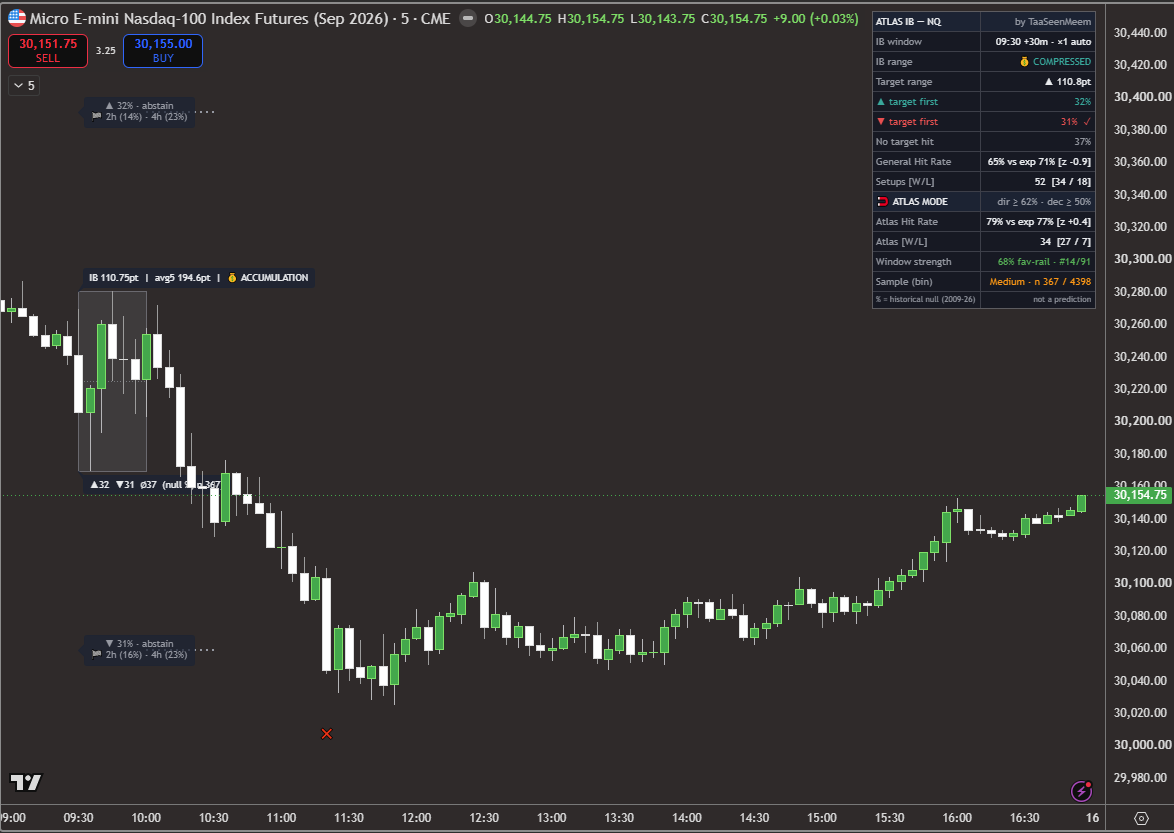
| Fri 14 Aug | 110.75 | 💰 Accumulation | 32% | 31% | 37% | 367 | abstain | ▲ 110.8 pt (×1) | ❌ ~11:20 |
▲ / ▼ / ∅ are the measured shares of comparable historical windows in which the upper target was reached first, the lower target was reached first, or neither was reached by the session close; n is how many such windows sit behind them. Every reading on this page was taken with the indicator on its default Auto setting, which derives the target distance from the window's own range; no setting was changed at any point during the week. Outcome times are New York time, read from the position of the outcome mark on the chart; on these 5-minute charts that is accurate to within a few minutes.
Two comparisons appear in every capture, and they answer different questions. The box tag grades the window against its own last five sessions (💰 accumulation, ⚖️ normal, 🚀 expansion), while the Auto target multiple follows the indicator's separate comparison against the full 17-year history, which is why a ⚖️ Normal box can still carry a ×1 target, as Tuesday's hour and Wednesday's half hour both do this week. The Window strength row visible in these tables read 68% favoured-rail all week, ranking these two windows #14 of 91 (half hour) and #11 of 91 (hour) among the windows the indicator measures by that yardstick; it describes the window rather than the day, so it is quoted once here and not per session.
The week ran live on Atlas IB v1.19; these charts were re-captured on v1.20, a presentation-only update. Every figure is identical, and the only visible difference is the position of one row in the status table.
The longer window waits for the whole first hour to complete before it commits. It gets a bigger, better-defined range to work from and, usually, a target that sits further away in points.
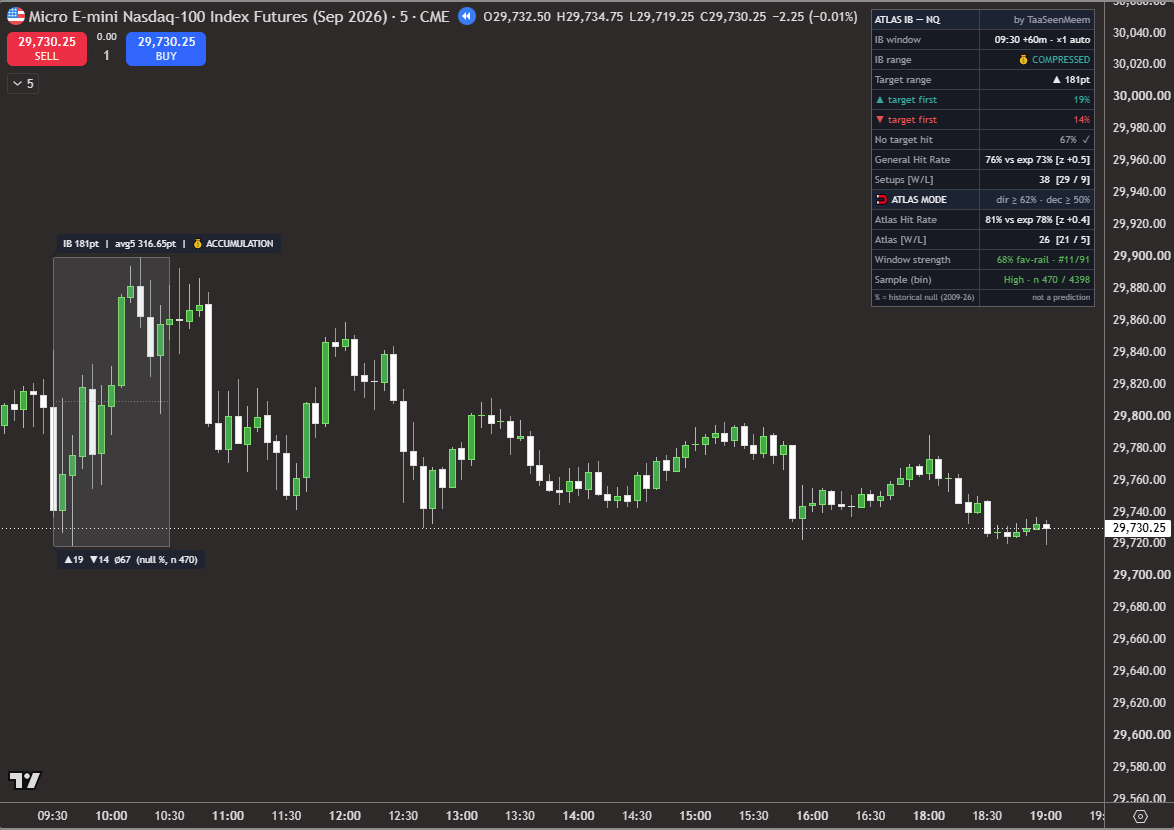
181 points against a five-session average of 317 earns the 💰 ACCUMULATION tag, and a compressed hour is exactly where the indicator has least to say. Neither rail comes close to the threshold, both stay grey, and the badge reads abstain.
Look at where the weight sits: ∅ 67% is more than three times either direction. The single most likely outcome, by a wide margin, was that price would reach neither target before the close. That is what happened. The session drifted through the lower half of the window's range and spent the afternoon going nowhere in particular.
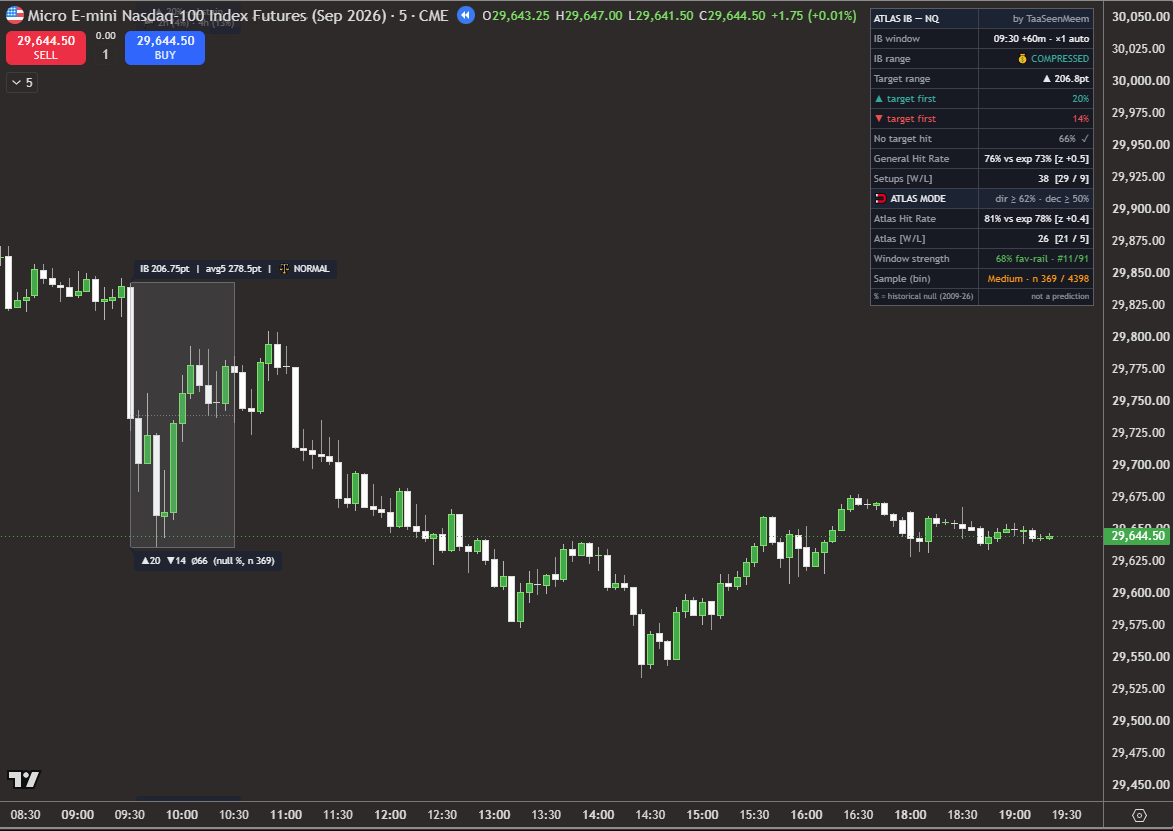
Another abstain, and another ∅ in the sixties. But this session was not quiet. The day ranged across nearly three hundred points top to bottom, most of them a long afternoon slide, with a partial recovery into the close.
That is the distinction the ∅ column is drawing, and it is easy to miss. It is not a forecast of a flat tape. It is a statement about reach: whether price is likely to travel a specific distance in one direction before the session ends. Tuesday moved plenty and still reached neither target. A trader holding for the directional destination got nothing out of a day with a great deal of movement in it.
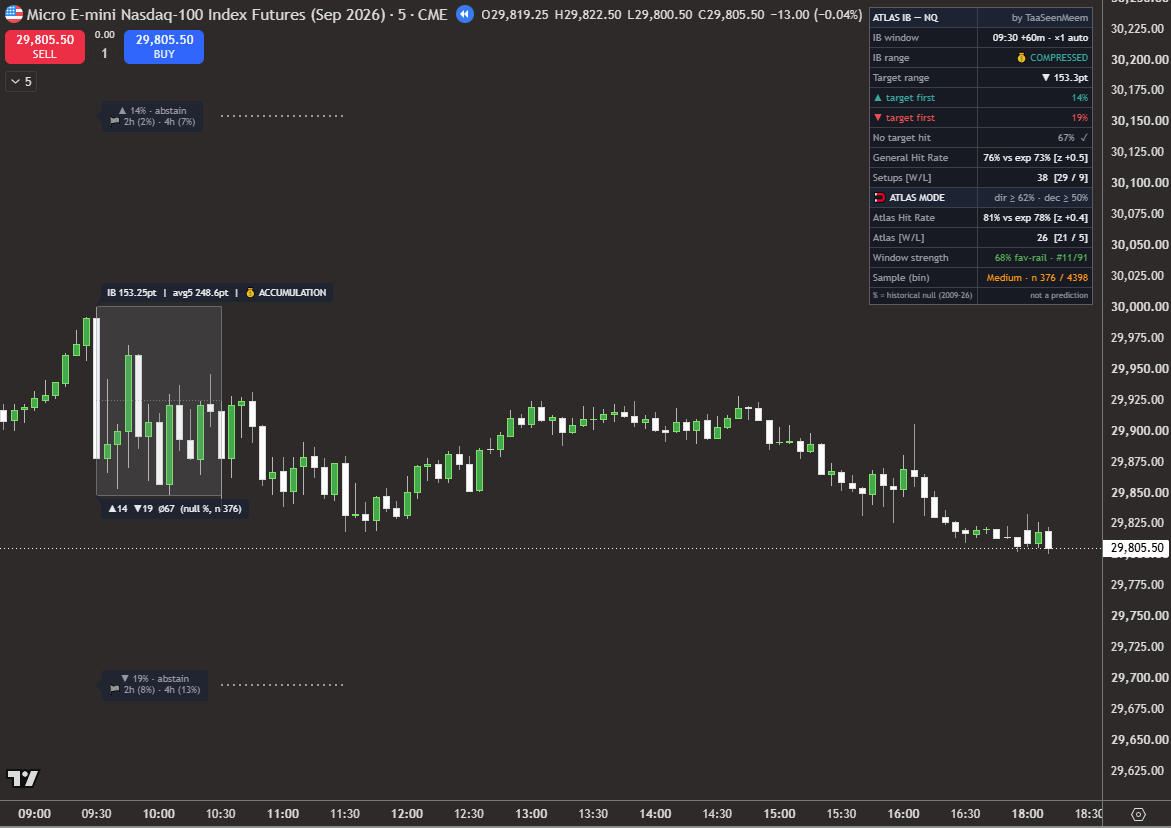
153 points against a five-session average of 249, the second accumulation tag of the week and the third window running to abstain. The shape is by now familiar: ∅ 67%, both rails grey, neither direction anywhere near a lean.
Worth noting how consistent these compressed mornings are. Monday and Wednesday produced almost the same table, 19/14/67 and 14/19/67, from different ranges on different days. The ∅ share is not reacting to the day's news, it is reacting to how little ground the first hour covered.
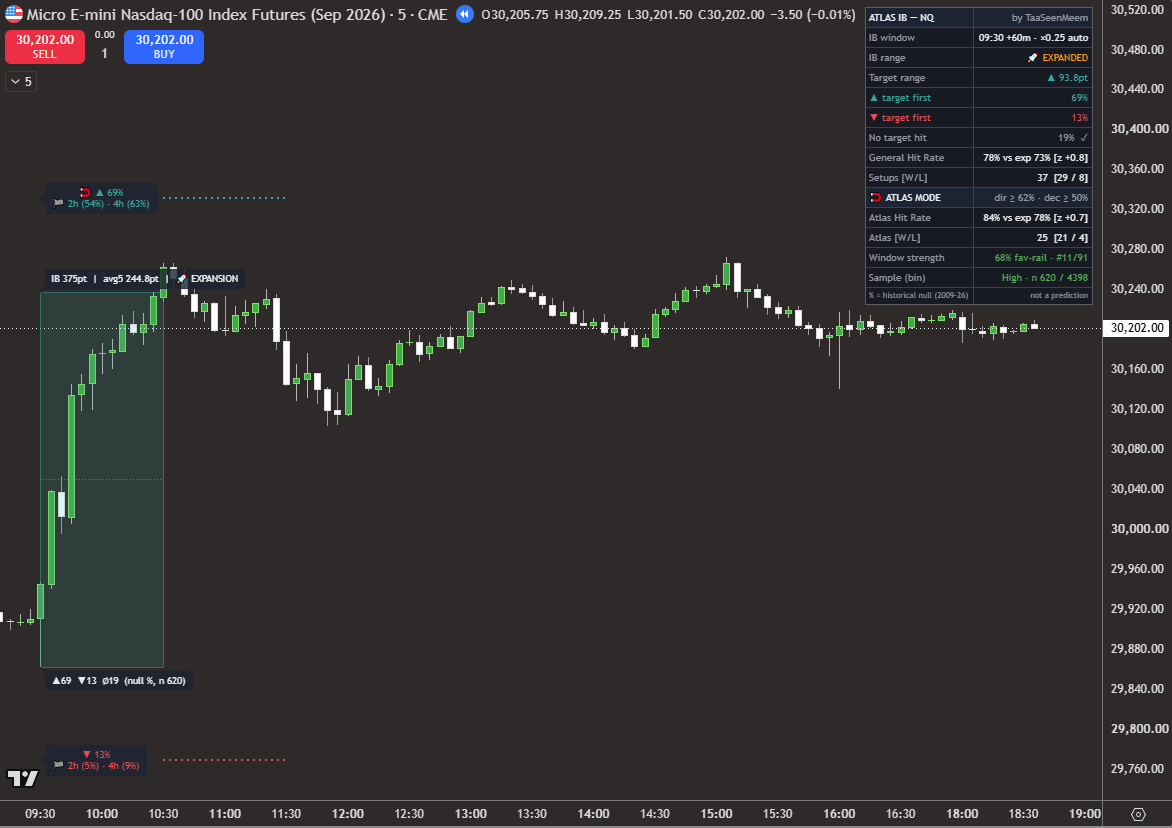
375 points against a five-session average of 245. This is the one genuinely expansive hour of the week, and the only 60-minute window that produced a lean: ▲ 69%, clear of the 62% threshold, magnet on the upper rail, box tinted.
It did not get there. Price spent the session pressing against the window's high from inside, poked about twenty points beyond it on the mid-afternoon push, and settled back. The target sat 94 points above that high, and the run to it never came. The race closed unresolved and the tick prints against ∅ 19%, the least likely of the three branches.
The half-hour window on the same morning did reach its target, which is the comparison worth making, and it is further down this page. Same direction, same conviction, different destination.
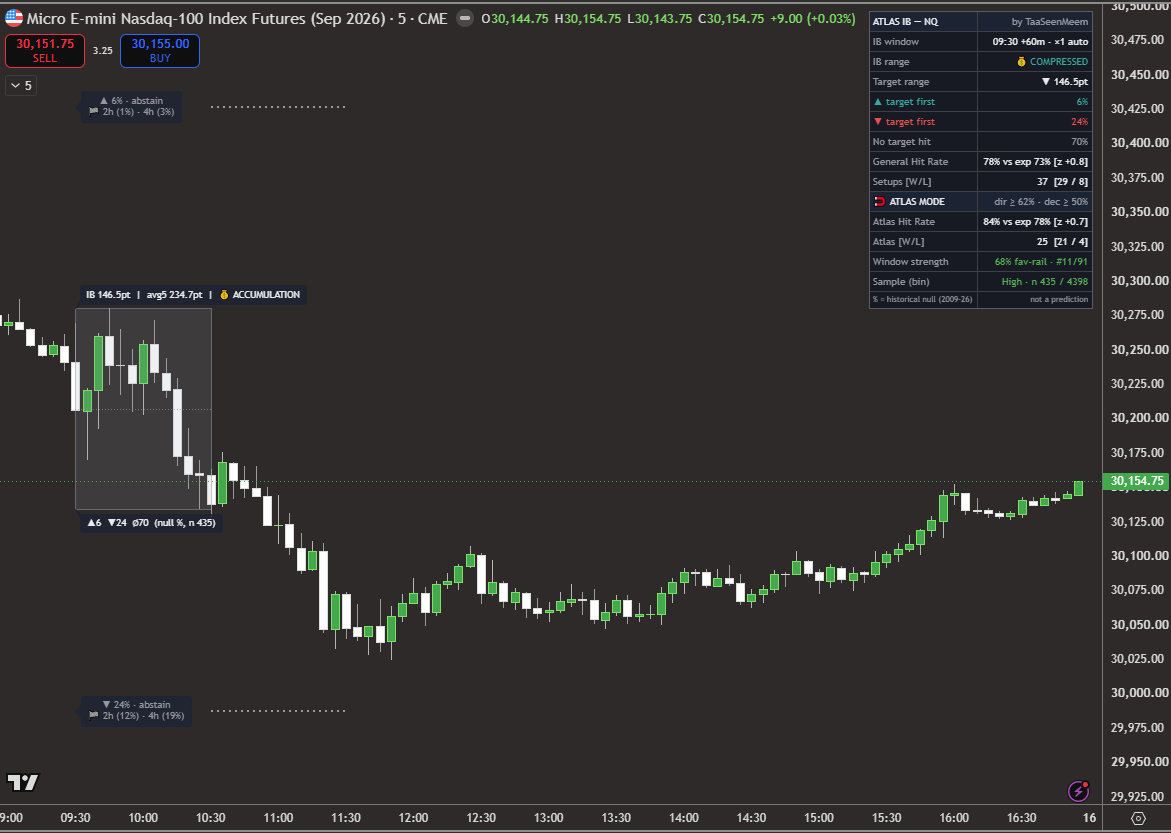
The most lopsided table of the week, and still an abstain. Of the windows that resolved at all, the downside took it four times out of five. But only 30% resolved in the first place, and ∅ 70% carries the rest.
This is the cleanest illustration on the page of the two separate questions the indicator asks. Which way, if it moves? Down, decisively. Will it move far enough to matter? Almost certainly not. A lean needs both answers, so the rails stay grey.
Price did sell off through the morning and then ground back up into the close without reaching the target. One presentational note: a window that reaches neither target is only marked as settled when the next session opens, and on a Friday the next session is Sunday evening. Friday's close is the effective resolution point, so this window shows as still open on a chart loaded to the end of the week.
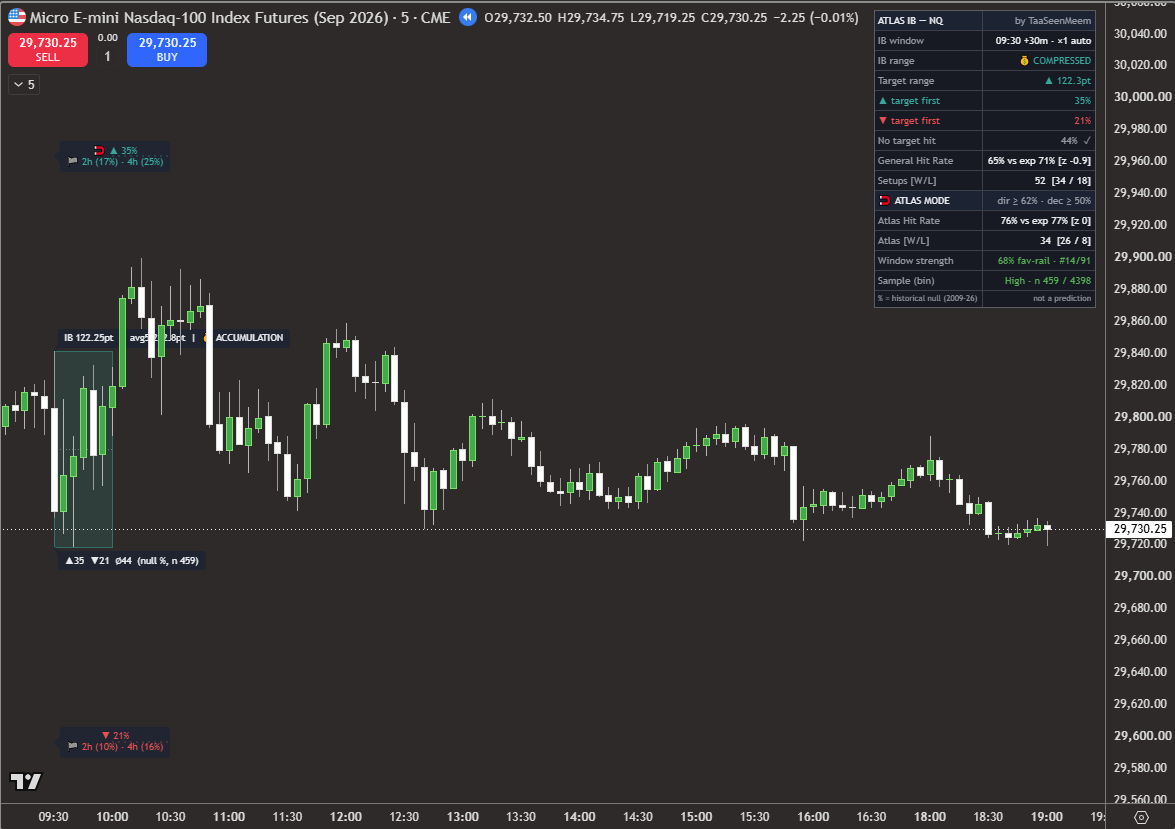
The shorter window commits half an hour earlier, from a smaller range, and its target is therefore usually nearer. It is a different measurement of the same morning, not a second opinion on it.
The half hour reads Monday differently from the hour, and it is worth understanding why. Atlas mode does not ask whether the leading share is large in absolute terms. It asks two things: of the windows that resolved, did one side take enough of them, and did enough of them resolve at all. Here 35% against 21% is a 62 to 38 split of the decided races, which just clears the bar, and 56% resolved, which clears the other. So the magnet appears on a 35% rail.
It is a lean, but a thin one, and the chart is honest about that: ∅ 44% is still the largest single number on it. Price pushed above the box shortly after the window closed, stalled well short of the target, and spent the rest of the day drifting back down. The 44% branch is the one that landed.
The only ⚖️ NORMAL window of the week, and the only reading where the vast majority of comparable sessions resolved: ∅ is just 15%. Something was expected to happen. The problem is the split. 38% up against 48% down is close to a coin flip once you set the undecided cases aside, nowhere near the threshold, so both rails stay grey.
Then the 15% landed anyway. Price fell hard through the afternoon and stopped just short of the lower target before turning back up. Six sessions out of seven in this table would have reached one side or the other. This one missed by a small margin, which for a race scored to the close is the same as not getting there.
The lesson is not that the table was wrong. A 15% branch lands roughly one time in seven, and a set of frequencies that never produced its unlikely outcomes would be the suspicious one. The lesson is that this is what a low ∅ buys you: better odds, not a guarantee.
This is the closest the week came to a fourth lean. 36% down against 23% up is a 61 to 39 split of the decided races, and the threshold is 62. One percentage point separates this window from a magnet on the lower rail.
We are showing it precisely because it is marginal. A threshold has to sit somewhere, and sitting somewhere means occasionally declining a call that only just fails. The alternative, moving the bar to fit the case in front of you, is how a measurement stops being one.
As it happens the day finished in the ∅ 41% branch, the largest of its three shares, so the abstain cost nothing here. That is not the justification for the rule. The rule is worth keeping whether or not any particular near miss turns out well.
318 points in thirty minutes, against a five-session average of 193 for the same window. The opening half hour ran almost vertically and the 🚀 EXPANSION tag follows. The table that comes back is the strongest of the week by some distance: ▲ 80%, ∅ down to 6%, and 71% of comparable windows resolving up inside two hours.
Price cleared the target at about 10:30, half an hour after the window closed, and the magnet-and-tick mark prints on the chart.
Now hold this beside the same morning's 60-minute window. Both leaned up. Both were right about direction. Only this one was paid, because the hour's extra range put its target higher up, and price stopped in between the two. Direction and reach are separate questions on the same chart, and the week's single result turns on the second one.
32% against 31%. It is difficult to construct a flatter table than this one. The two directions are separated by a single percentage point, ∅ is larger than either of them, and the shorter-horizon figures are almost identical on both sides as well.
Price took the lower target at about 11:20, and because the upper rail held the marginally larger share the mark prints as a ❌. That is the week's only cross, and it is worth being precise about what it means: the indicator scores the larger of the two shares whether or not that share cleared the lean threshold, so an abstained window can still be marked wrong. No lean was offered here, so nothing was risked on it.
Reading a one-point gap as a directional signal is exactly the mistake the abstain state exists to prevent.
Seven of ten windows this week declined to lean. That is unusual, and it makes this the right week to be clear about what an abstain is telling you.
An abstain is not a forecast of a flat market. Tuesday makes that plain: both windows abstained, and the session still ranged across nearly three hundred points. There was a great deal to trade. What there was not, on the indicator's measurement, was a run far enough in one direction to be worth holding for.
That distinction points at a practical adjustment, and most traders will already recognise it. On a session that is unlikely to produce a directional run, many will switch to base hits: shorter-duration trades, taken and closed inside the move rather than held for a destination. Scalping, in other words, in place of position-holding.
Atlas IB does not tell you where those trades are. The levels for short-duration trading come from your own method, your own reading of structure, and they will differ from one trader to the next. What the indicator contributes is the decision that sits upstream of all of that: whether today is a day to hold for a run, or a day to take what the range offers.
On the evidence of this week, that upstream call was worth having. Of the seven abstained windows, six reached neither target. The seventh, Friday's half hour, reached one on a table that was as close to an even split as these tables get. A trader who read those seven windows as "no run expected" and adjusted was wrong-footed by at most one of them.
Four things, and the week did not go well, which is rather the point of publishing it.