Weekly backtests → w/c 17 August 2026

Week commencing Monday 17 August 2026

Five 09:30 cash-open sessions, each read at both durations Atlas IB offers, a 60-minute window and a 30-minute one. Ten readings in total, seven of them leans, every lean short, and one half-hour forecast that came back identical four mornings running. The first week captured at the recommended ×0.5 target setting.

At a glance

Every window that appeared, in the order the indicator produced them.

7
windows in 🧲 Atlas mode, every one of them leaning short
3
windows that abstained, offering no directional read
5 / 10
windows where neither target was reached by the close
3 / 7
Atlas-mode leans that reached their target; none resolved against
SessionIB rangeBox tag▲▼∅n StateTarget (×0.5)Outcome
60-minute window · 09:30 to 10:30
Mon 17 Aug109.25💰 Accumulation24%35%41%347abstain▼ 54.6 pt✅ ~13:23
Tue 18 Aug201.75⚖️ Normal31%33%36%386abstain▼ 100.9 pt∅ neither
Wed 19 Aug366.25🚀 Expansion18%41%41%410🧲 Atlas ▼▼ 183.1 pt∅ neither
Thu 20 Aug165.75💰 Accumulation18%41%41%410🧲 Atlas ▼▼ 82.9 pt🧲✅ ~14:10
Fri 21 Aug252.25⚖️ Normal18%41%41%410🧲 Atlas ▼▼ 126.1 pt∅ neither
30-minute window · 09:30 to 10:00
Mon 17 Aug100.50💰 Accumulation50%36%14%365abstain▲ 50.3 pt❌ ~13:20
Tue 18 Aug165.00⚖️ Normal28%53%19%440🧲 Atlas ▼▼ 82.5 pt🧲✅ ~11:09
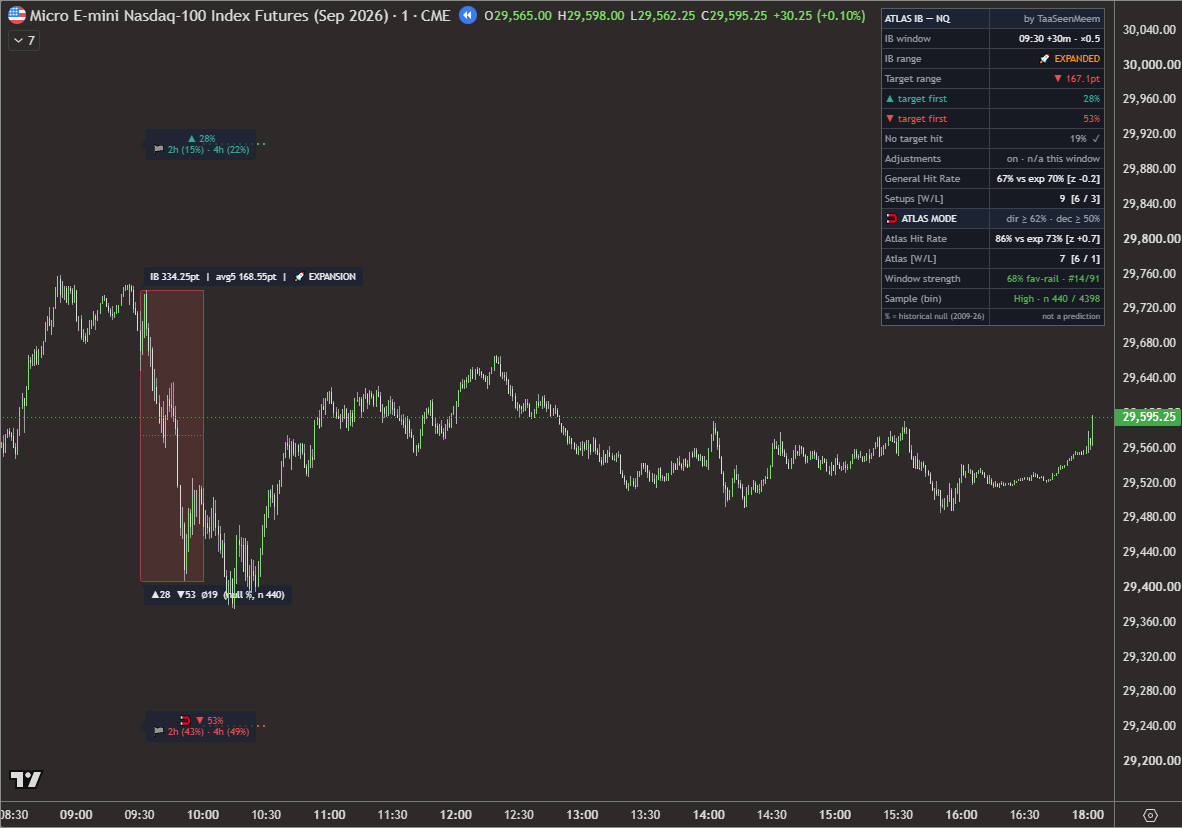
Wed 19 Aug334.25🚀 Expansion28%53%19%440🧲 Atlas ▼▼ 167.1 pt∅ neither
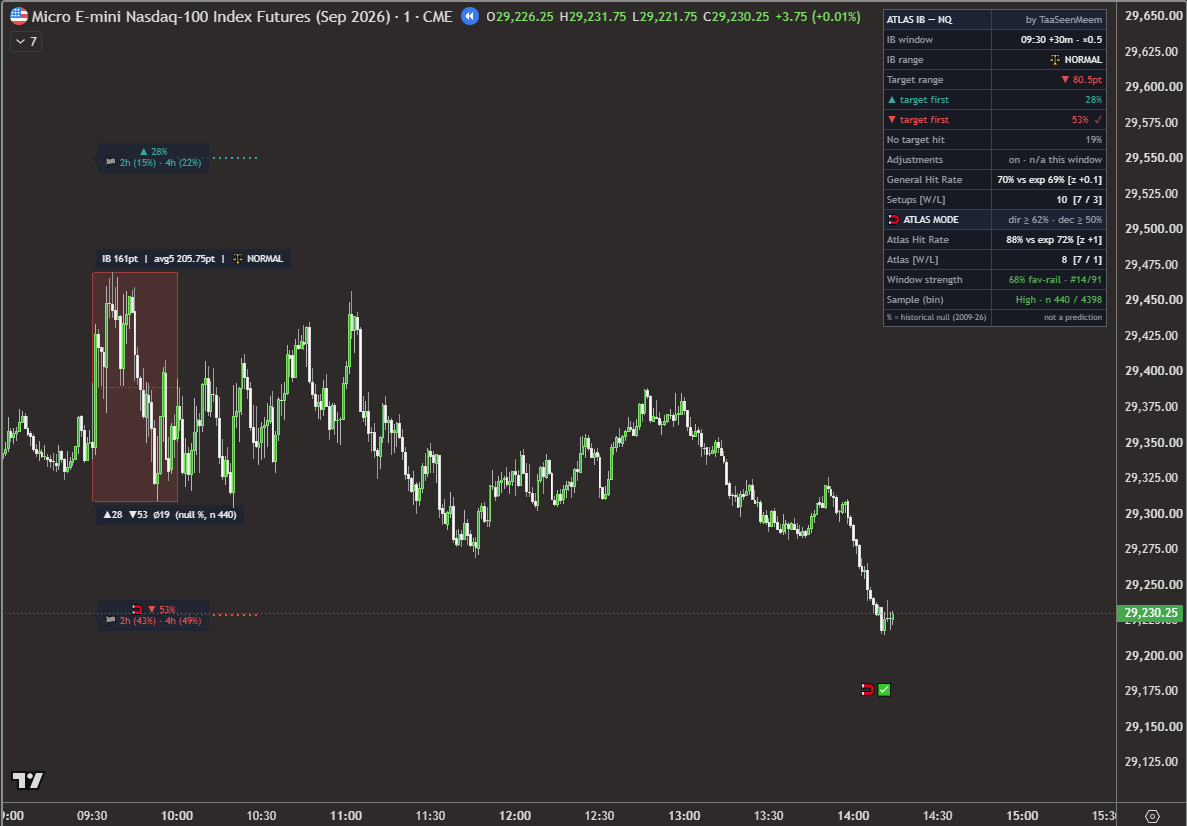
Thu 20 Aug161.00⚖️ Normal28%53%19%440🧲 Atlas ▼▼ 80.5 pt🧲✅ ~14:10
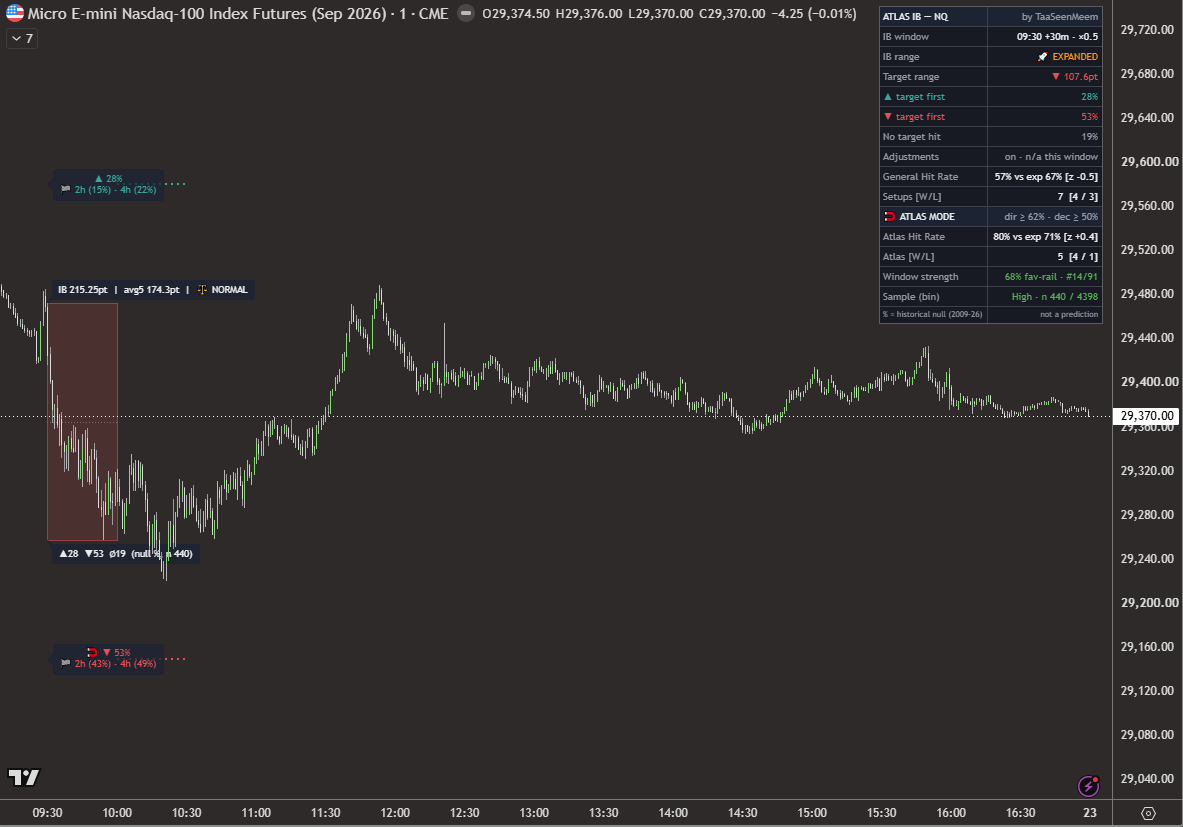
Fri 21 Aug215.25⚖️ Normal28%53%19%440🧲 Atlas ▼▼ 107.6 pt∅ neither

▲ / ▼ / ∅ are the measured shares of comparable historical windows in which the upper target was reached first, the lower target was reached first, or neither was reached by the session close; n is how many such windows sit behind them. Every reading on this page was taken with the target multiple set to ×0.5, which is the setting the Atlas IB handbook now recommends for NQ and the default in the current build; the first two weeks on the record ran on Auto, and no setting was changed during this week. Outcome times are New York time, read from the position of the outcome mark on these 1-minute charts, so they are good to about a minute.

Two comparisons appear in every capture, and they answer different questions. The box tag grades the window against its own last five sessions (💰 accumulation, ⚖️ normal, 🚀 expansion), while the status table's regime row grades it against the full seventeen-year history, and the two legitimately disagree: Tuesday's hour was ⚖️ Normal on the box and compressed in the table, and Friday's two windows were Normal on the box and expanded in the table. With the multiple fixed at ×0.5 the regime no longer moves the rails, so it is reported here but it is not doing anything to the targets. For comparison, Auto would have set ×1 on the compressed boxes and ×0.25 on the expanded ones. The Window strength row read 68% favoured-rail all week, #14 of 91 for the half hour and #11 of 91 for the hour; it describes the window rather than the day.

The week's only red folder USD release was the FOMC minutes at 14:00 ET on Wednesday, four and a half hours after the window opened; it is marked against the day. The flash PMIs printed at 09:45 ET on Friday, inside both windows, and were rated low impact that week.

None of this week was in the sample. The tables Atlas IB reads were measured on NQ history ending 27 July 2026. Every session below happened afterwards. The percentages on these charts are fixed lookups, and the chart engine performs no estimation, so the figures shown here are exactly what a live user saw a few minutes after each window closed.
Window one

The 60-minute window · 09:30 to 10:30

The longer window waits for the whole first hour to complete before it commits. It gets a bigger, better-defined range to work from and, at a fixed multiple, a target that sits further away in points.
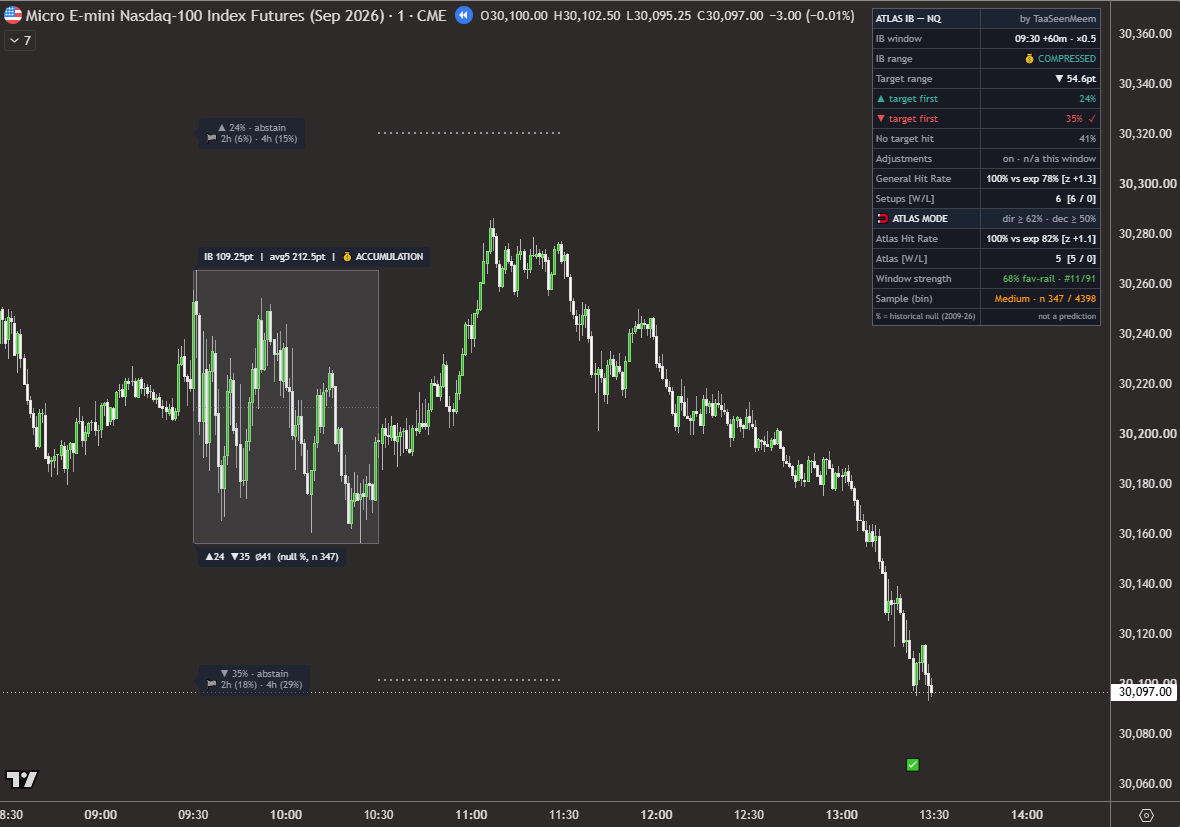
Monday 17 August 2026, 09:30 60-minute Initial Balance on NQ, 1-minute chart: a narrow accumulation box with both rails grey and labelled abstain at 24% and 35%, price pushing above the box late morning, then selling off from midday through the lower target, with a plain green tick printed in the early afternoon.
Mon 17 Aug 2026 · 09:30 +60m · NQ 1-minute
Monday 17 August

Two weak shares, the larger one landed, and the mark says so

✅ larger share reached first · ~13:23 · abstained window
  • IB range109.25 pt · avg5 212.50 · 💰 Accumulation
  • Split▲ 24% · ▼ 35% · ∅ 41% (n 347)
  • Shorter horizons▼ 2h 18% · 4h 29%
  • Target distance▼ 54.6 pt (×0.5)

109 points against a five-session average of 213 earns the 💰 ACCUMULATION tag, and the table that came back was weak on both sides: 24 up, 35 down, ∅ 41% the largest share. 35 of the 59 that resolve is 59% of the decided share, three short of the 62 the lean test wants, so both rails stayed grey.

Price pushed above the box through late morning, came back, and then sold off steadily from about 12:30. The lower target, 54.6 points under the box low, was reached at about 13:23, and a plain green tick printed: the larger of the two shares was the side that got there first, on a window that had offered no lean.

The half-hour window on the same morning read the other way, favoured the upside, and was marked wrong by the same move. That comparison is further down, and it is the most useful thing Monday produced.
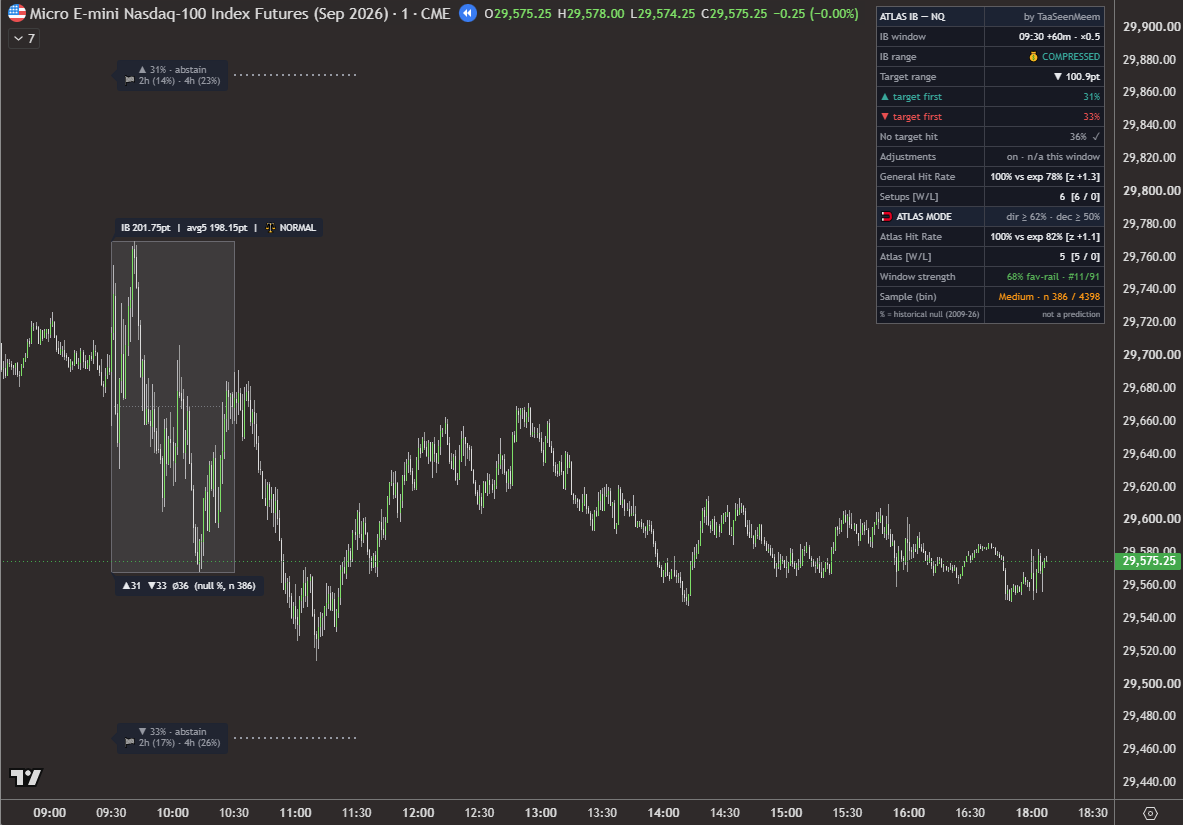
Tuesday 18 August 2026, 09:30 60-minute Initial Balance on NQ, 1-minute chart: a normal-sized box with both rails grey and labelled abstain at 31% and 33%, price dropping below the box late morning to within about twenty points of the lower target, then recovering and ranging into the close with a tick against the no-target-hit row.
Tue 18 Aug 2026 · 09:30 +60m · NQ 1-minute
Tuesday 18 August

Thirty-one against thirty-three, and a miss by twenty points

∅ neither target reached · the 36% branch
  • IB range201.75 pt · avg5 198.15 · ⚖️ Normal
  • Split▲ 31% · ▼ 33% · ∅ 36% (n 386)
  • Shorter horizons▼ 2h 17% · 4h 26%
  • Target distance▼ 100.9 pt (×0.5)

The flattest table of the week. 31 up, 33 down, 36 neither: three shares within five points of one another, and the two directional ones separated by a single percentage point. The box itself was ordinary, 202 points against a 198 average, ⚖️ NORMAL on its own ruler and compressed on the table's.

Price broke below the box before 11:00 and got to within roughly twenty points of the lower target before turning. The recovery ran all afternoon and the session closed inside the box. Neither rail was reached, and the no-target-hit row carries the tick.

A 31 / 33 split is not a lean and was never going to be one. What the window did do was state the reach question honestly: a little over a third of comparable hours get to neither rail, and this was one of them, by a margin that looks small on the chart and counts for nothing in the scoring.
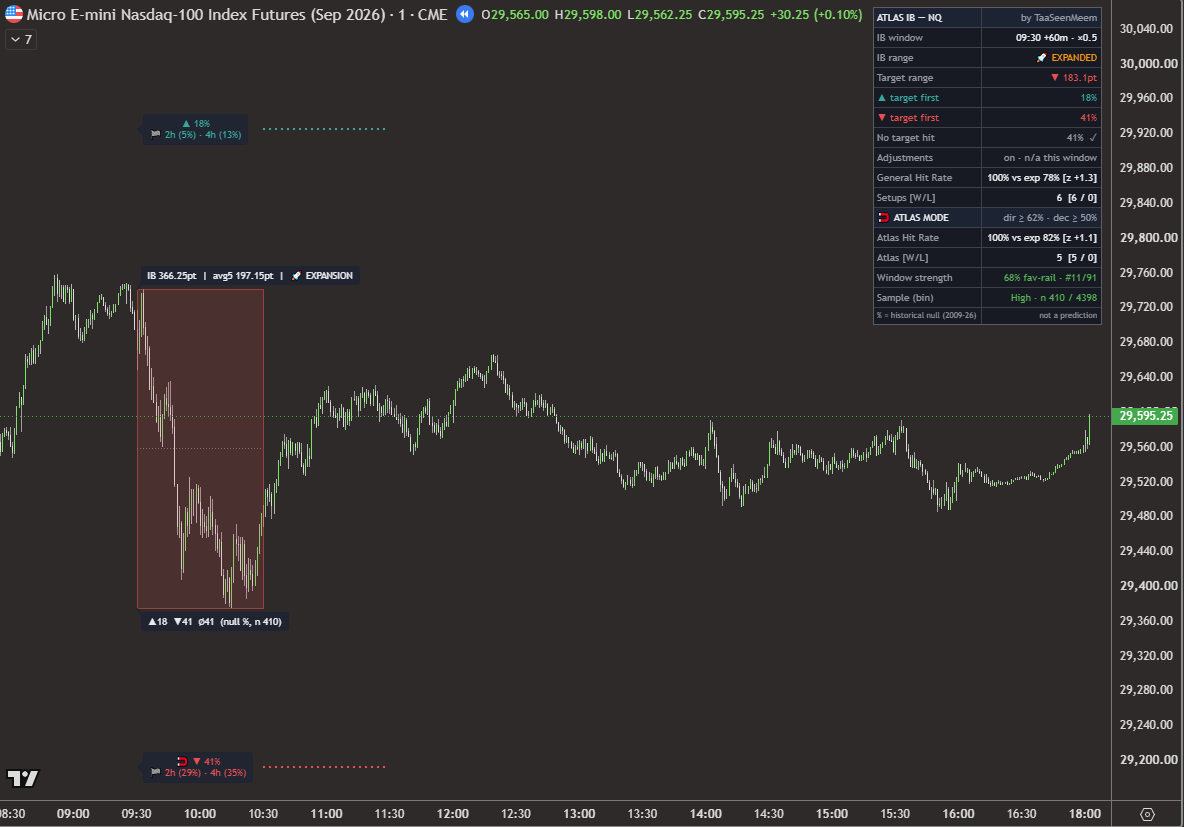
Wednesday 19 August 2026, 09:30 60-minute Initial Balance on NQ, 1-minute chart: a tall red-tinted expansion box formed by a sharp drop in the first hour, a magnet on the 41% lower rail, and price ranging above the box low for the rest of the session without reaching either target, with a tick against the no-target-hit row.
Wed 19 Aug 2026 · 09:30 +60m · NQ 1-minute
Wednesday 19 August

The widest hour of the week, a short lean, and a target 183 points away

∅ neither target reached · the 41% branch 🔴 FOMC minutes · 14:00 ET
  • IB range366.25 pt · avg5 197.15 · 🚀 Expansion
  • Split▲ 18% · ▼ 41% · ∅ 41% (n 410)
  • Shorter horizons▼ 2h 29% · 4h 35%
  • Target distance▼ 183.1 pt (×0.5)

The first hour fell hard, 366 points top to bottom against a five-session average of 197, and the 🚀 EXPANSION tag follows. The read was 18 up, 41 down, 41 neither. That is a lean: 41 of the 59 that resolve is 69% of the decided share, comfortably clear of 62, and 59% resolving clears the other bar, so the magnet printed on the lower rail.

The rail sat 183 points under the box low. Price made the hour's low in the last minutes of the window, bounced, and spent the rest of the day between the box's midpoint and its low. The FOMC minutes at 14:00 ET produced no move worth the name on this chart; the afternoon stayed inside the morning's range. Neither target was reached.

Read the two 41s together. The lean was genuine, because the decided sessions split 69 to 31, and so was the warning, because as many comparable sessions reached neither rail as reached the favoured one. Both numbers were on the chart at 10:30. The 41% that landed was the one on the right.
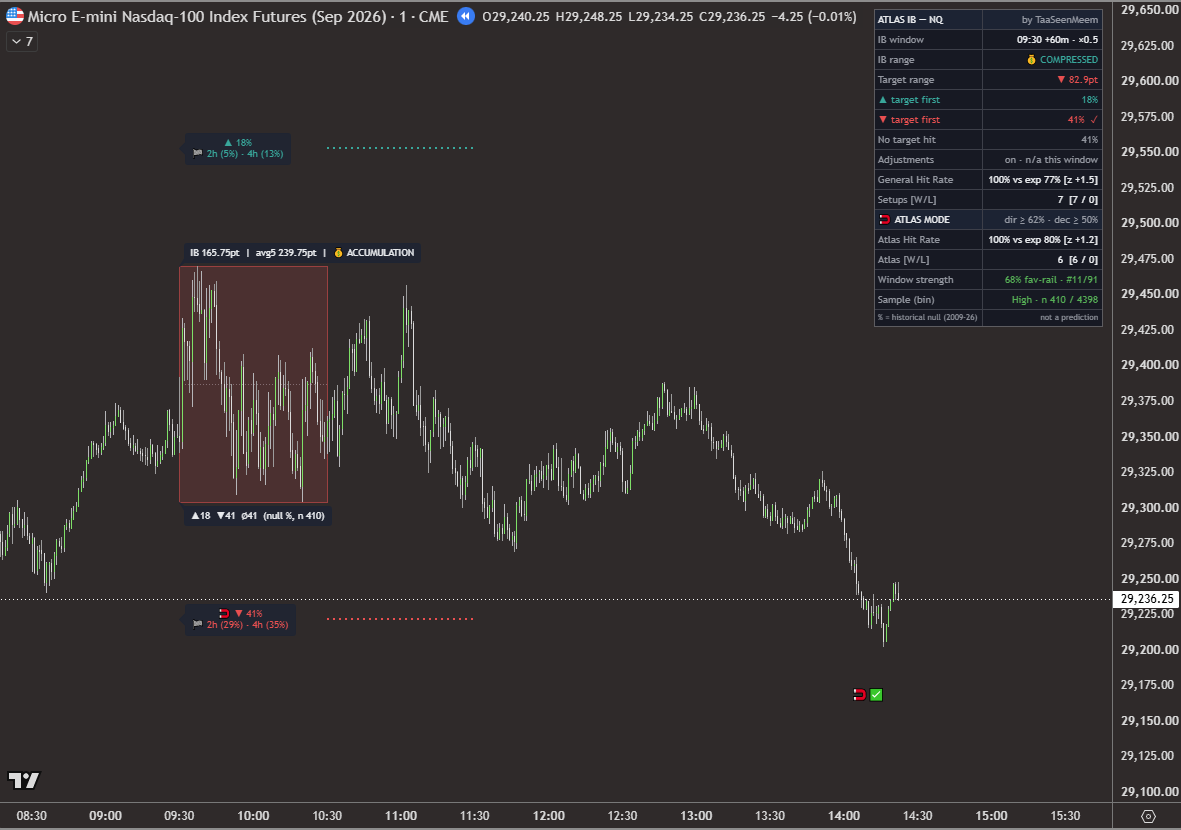
Thursday 20 August 2026, 09:30 60-minute Initial Balance on NQ, 1-minute chart: a narrow red-tinted accumulation box with a magnet on the 41% lower rail, price ranging through the morning and early afternoon, then falling through the lower target at about ten past two with a magnet-and-tick mark printed beneath.
Thu 20 Aug 2026 · 09:30 +60m · NQ 1-minute
Thursday 20 August

Wednesday's cell exactly, in a box less than half the size, and it reached

🧲✅ favoured side reached first · ~14:10
  • IB range165.75 pt · avg5 239.75 · 💰 Accumulation
  • Split▲ 18% · ▼ 41% · ∅ 41% (n 410)
  • Shorter horizons▼ 2h 29% · 4h 35%
  • Target distance▼ 82.9 pt (×0.5)

18 / 41 / 41 from 410 sessions: Wednesday's table, to the percentage point, out of the same sample. The box that produced it was 166 points, 💰 ACCUMULATION against a 240 average, less than half of Wednesday's. Same cell, same lean, same magnet on the lower rail; the difference is that at ×0.5 this target sat 83 points below the box rather than 183.

Price ranged for most of the day, then broke down from about 13:45 and took the target at about 14:10. The magnet-and-tick mark printed, and so did the same mark on the half-hour window, within a minute or two of it.

Wednesday and Thursday are the cleanest pair on the page. The lookup was identical; the thing that differed was how far price had to travel for it to count, and that was set by the size of the box. Reach is a distance question, and on these two mornings the distance was the whole story.
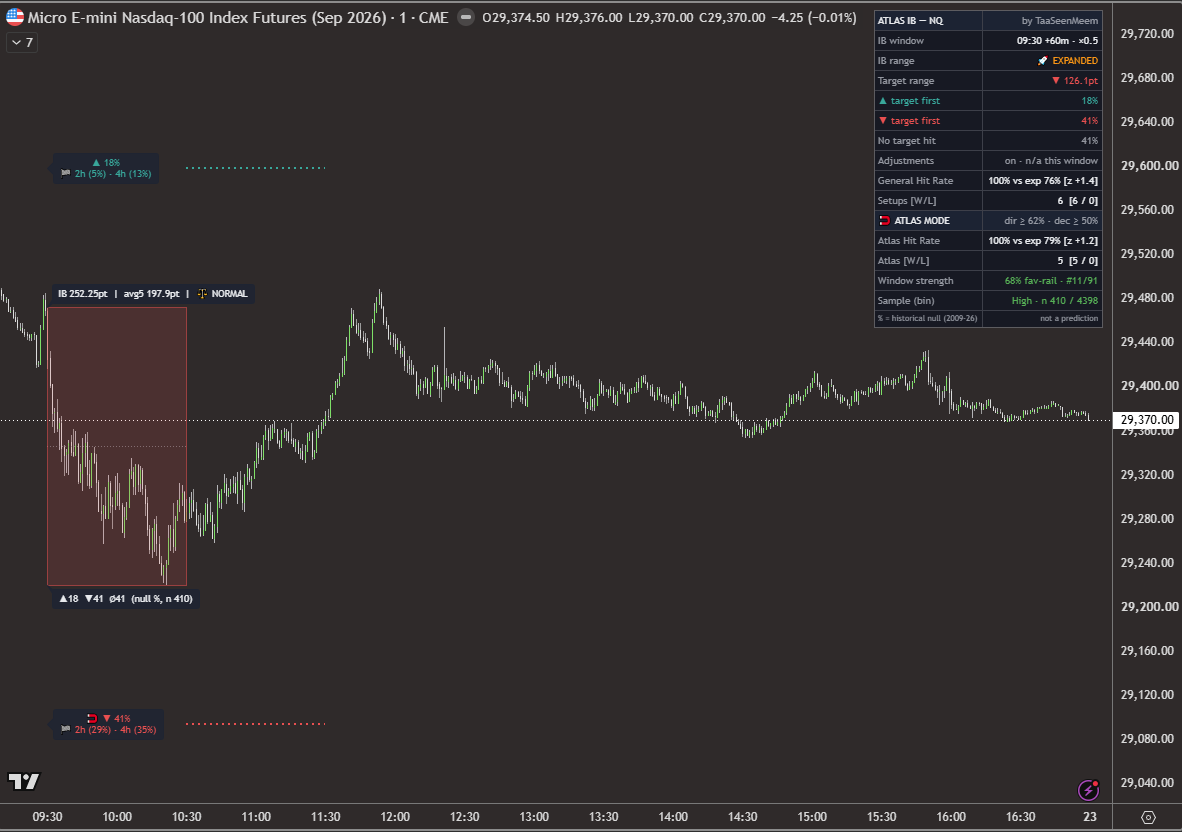
Friday 21 August 2026, 09:30 60-minute Initial Balance on NQ, 1-minute chart: a red-tinted box with a magnet on the 41% lower rail, price rallying back into the box after the window and ranging through the afternoon to the close without reaching either target, and no outcome mark printed.
Fri 21 Aug 2026 · 09:30 +60m · NQ 1-minute
Friday 21 August

The cell for a third day, and a Friday that stayed in the box

no target reached by the Friday close
  • IB range252.25 pt · avg5 197.90 · ⚖️ Normal
  • Split▲ 18% · ▼ 41% · ∅ 41% (n 410)
  • Shorter horizons▼ 2h 29% · 4h 35%
  • Target distance▼ 126.1 pt (×0.5)

The third consecutive hour to return 18 / 41 / 41. The box was 252 points, ⚖️ NORMAL against its five-day average and expanded against the whole history, and the lean was short again with a target 126 points below the box low. The flash PMIs printed at 09:45 ET, inside the window; they were a low-impact release that week and the chart shows no reaction to them.

Price made its low just after the window closed, rallied back through the box, and ranged for the rest of the session. Neither target was reached by the close. As on every Friday, the no-target-hit tick will not print until the next session opens on Sunday evening, so this chart shows the window still open; Friday's close has already settled it.

Three days, one cell: no target, target, no target. That is not the table being inconsistent. It is three draws from a cell that says 41% reach the favoured rail and 41% reach neither, landing one and two, which is about as ordinary as three draws can be.
Window two

The 30-minute window · 09:30 to 10:00

The shorter window commits half an hour earlier, from a smaller range, and its target is therefore usually nearer. It is a different measurement of the same morning, not a second opinion on it.

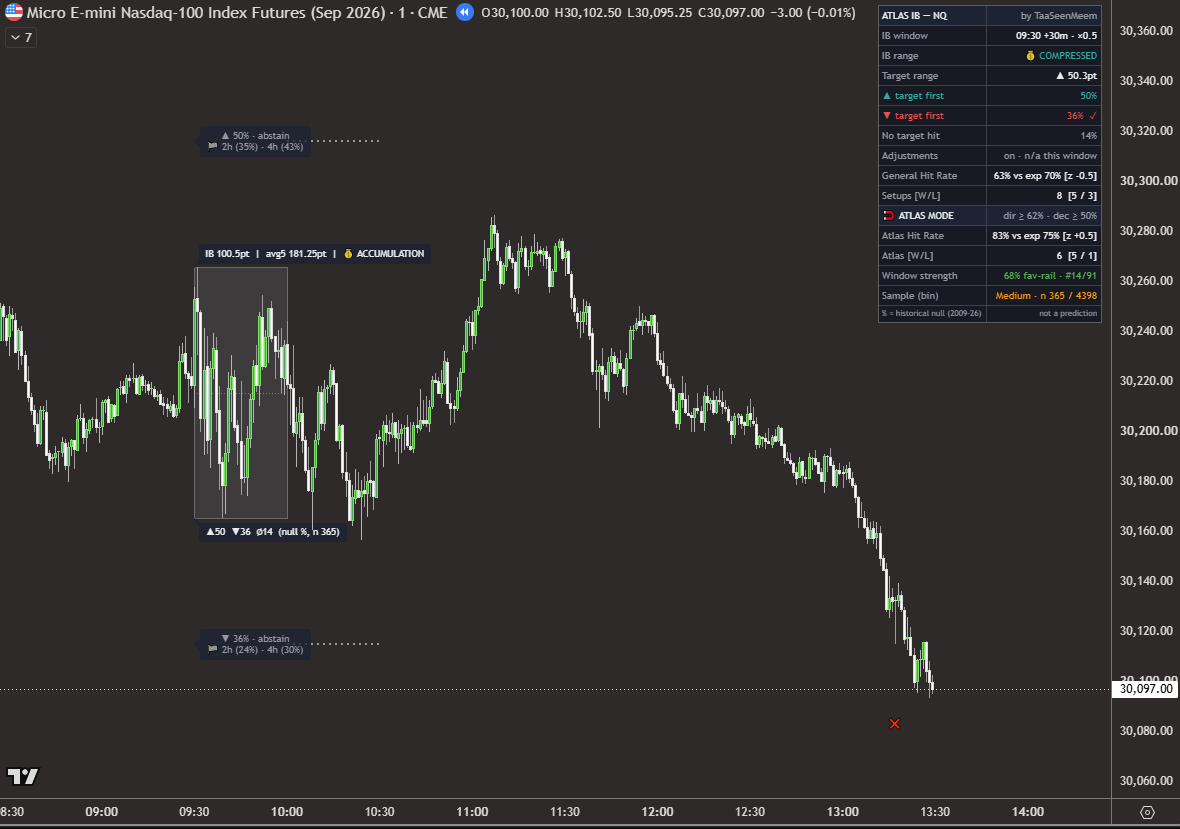
Monday 17 August 2026, 09:30 30-minute Initial Balance on NQ, 1-minute chart: a narrow accumulation box with both rails grey and labelled abstain at 50% and 36%, price rising to just short of the upper target late morning, then selling off through the lower target in the early afternoon with a red cross printed beneath.
Mon 17 Aug 2026 · 09:30 +30m · NQ 1-minute
Monday 17 August

The week's biggest up share, an abstain, and the week's only cross

❌ lower target reached first · ~13:20
  • IB range100.50 pt · avg5 181.25 · 💰 Accumulation
  • Split▲ 50% · ▼ 36% · ∅ 14% (n 365)
  • Shorter horizons▲ 2h 35% · 4h 43% · ▼ 2h 24% · 4h 30%
  • Target distance▲ 50.3 pt (×0.5)

A 100-point half hour, 💰 ACCUMULATION against a 181 average, and a table that expected something to happen: ∅ 14%, the lowest of the week. The upside got 50, the downside 36. That is 58% of the decided share, short of the 62 the lean test wants, so both rails stayed grey and the window abstained.

Price went up first, to within about 25 points of the upper target around 11:00, and turned. The afternoon sell-off took the lower target at about 13:20, and because the upper rail held the larger share the mark prints as a ❌.

It is the week's only cross, and for the third week running the only cross on the page sits on a window that had abstained. The indicator grades the larger of two shares whether or not that share cleared the lean test, which is the right thing for a record to do and the wrong thing to read as a call. No lean was offered here.

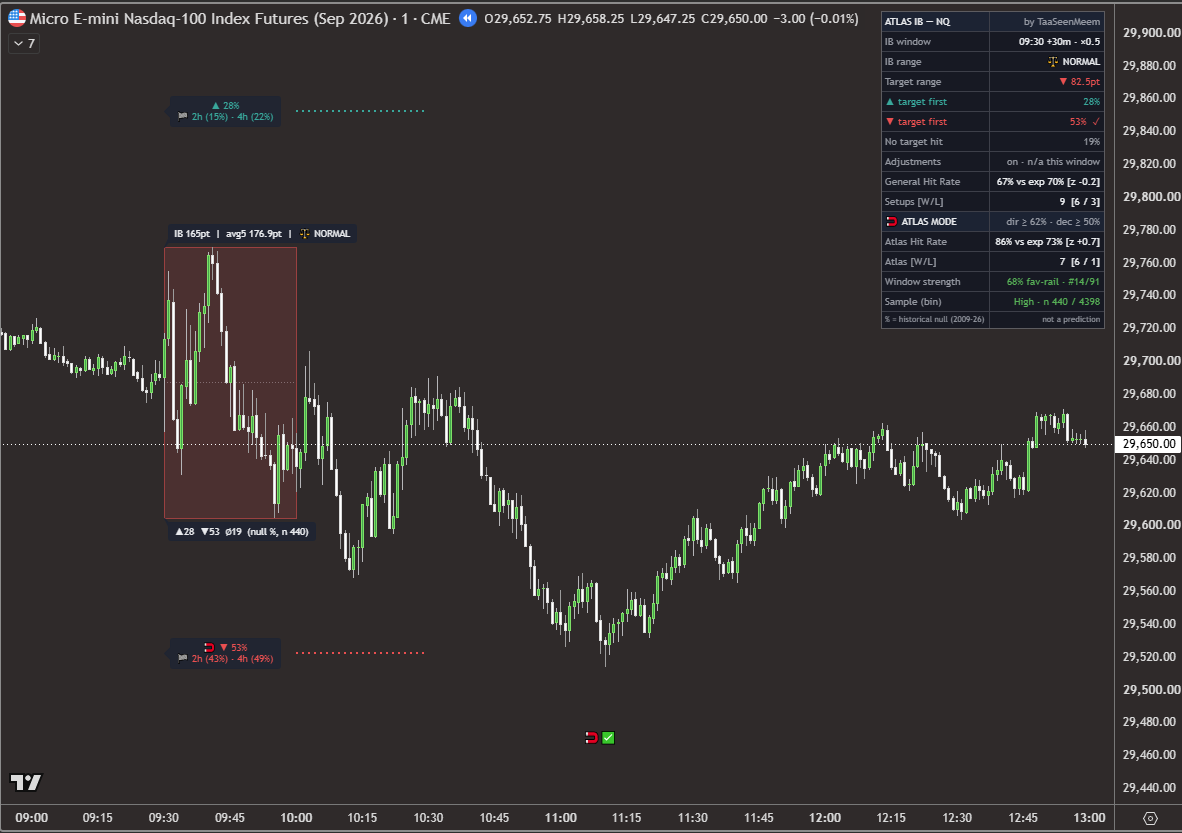
Tuesday 18 August 2026, 09:30 30-minute Initial Balance on NQ, 1-minute chart: a red-tinted normal box with a magnet on the 53% lower rail, price breaking down after 10:00 and reaching the lower target at about nine minutes past eleven, with a magnet-and-tick mark printed beneath.
Tue 18 Aug 2026 · 09:30 +30m · NQ 1-minute
Tuesday 18 August

The first of four identical half-hour reads, and it paid inside ninety minutes

🧲✅ favoured side reached first · ~11:09
  • IB range165.00 pt · avg5 176.90 · ⚖️ Normal
  • Split▲ 28% · ▼ 53% · ∅ 19% (n 440)
  • Shorter horizons▼ 2h 43% · 4h 49%
  • Target distance▼ 82.5 pt (×0.5)

An ordinary half hour, 165 points against a 177 average, ⚖️ NORMAL, and a clear table: ▼ 53%, 28 the other way, 19 neither. 53 of the 81 that resolve is 65% of the decided share, the magnet printed on the lower rail, and the target sat 82.5 points below the box.

Price broke the box low shortly after 10:00, ground lower through the next hour, and took the target at about 11:09. Magnet and tick.

Hold on to the numbers, because they come back. 28 / 53 / 19 out of 440 sessions is the read the half-hour window returned on Tuesday, Wednesday, Thursday and Friday. Four mornings, one cell. What happened next on each of them is the subject of the section after the charts.

Wednesday 19 August 2026, 09:30 30-minute Initial Balance on NQ, 1-minute chart: a tall red-tinted expansion box formed by a sharp drop in the first half hour, a magnet on the 53% lower rail, and price ranging for the rest of the day without reaching either target, with a tick against the no-target-hit row.
Wed 19 Aug 2026 · 09:30 +30m · NQ 1-minute
Wednesday 19 August

The same read, a box twice the size, and a target that sat too far

∅ neither target reached · the 19% branch 🔴 FOMC minutes · 14:00 ET
  • IB range334.25 pt · avg5 168.55 · 🚀 Expansion
  • Split▲ 28% · ▼ 53% · ∅ 19% (n 440)
  • Shorter horizons▼ 2h 43% · 4h 49%
  • Target distance▼ 167.1 pt (×0.5)

334 points in thirty minutes, double its five-day average, 🚀 EXPANSION, and the same 28 / 53 / 19 as Tuesday. The lean was the same too: magnet on the lower rail. What changed was the distance. At ×0.5 the target was 167 points below the box low, twice Tuesday's.

Price made its low a few minutes after the window closed, about ten points under the box, and never went back. The session ranged in the lower half of the box and the FOMC minutes at 14:00 ET did not take it anywhere new. The no-target-hit row carries the tick: the 19% branch.

For comparison, Auto would have set a quarter multiple on a box this expanded, putting the target about 84 points out rather than 167. Whether that would have been reached is not something this page can say, and we do not score what was not on the chart. What the chart does show is the cost of a fixed multiple on an expanded morning: the same lean, a far larger ask.

Thursday 20 August 2026, 09:30 30-minute Initial Balance on NQ, 1-minute chart: a red-tinted normal box with a magnet on the 53% lower rail, price ranging through the morning and early afternoon, then falling through the lower target at about ten past two with a magnet-and-tick mark printed beneath.
Thu 20 Aug 2026 · 09:30 +30m · NQ 1-minute
Thursday 20 August

Third day of the cell, a Tuesday-sized box, and the 53% side landed again

🧲✅ favoured side reached first · ~14:10
  • IB range161.00 pt · avg5 205.75 · ⚖️ Normal
  • Split▲ 28% · ▼ 53% · ∅ 19% (n 440)
  • Shorter horizons▼ 2h 43% · 4h 49%
  • Target distance▼ 80.5 pt (×0.5)

161 points, ⚖️ NORMAL, four points narrower than Tuesday's box, and the same cell for the third morning running. Magnet on the lower rail, target 80.5 points under the box.

The morning ranged, the early afternoon ranged, and at about 13:45 the market broke. The target went at about 14:10, within a minute or two of the 60-minute window's, and the magnet-and-tick mark printed on both.

Tuesday and Thursday were the two half-hour boxes of the week between 160 and 166 points. Both were paid. Wednesday and Friday were 334 and 215. Neither was. Same cell all four days; the targets were 80 to 83 points away on the two that reached and 108 to 167 on the two that did not. We would not build a rule on four windows, and neither should you, but the pattern is the one the whole record keeps showing.

Friday 21 August 2026, 09:30 30-minute Initial Balance on NQ, 1-minute chart: a red-tinted box with a magnet on the 53% lower rail, price dipping below the box late morning, recovering, and ranging into the Friday close without reaching either target, and no outcome mark printed.
Fri 21 Aug 2026 · 09:30 +30m · NQ 1-minute
Friday 21 August

Fourth day, same cell, and a quiet close

no target reached by the Friday close
  • IB range215.25 pt · avg5 174.30 · ⚖️ Normal
  • Split▲ 28% · ▼ 53% · ∅ 19% (n 440)
  • Shorter horizons▼ 2h 43% · 4h 49%
  • Target distance▼ 107.6 pt (×0.5)

215 points, ⚖️ NORMAL against its five-day average and expanded on the table's ruler, and 28 / 53 / 19 for the fourth consecutive morning. Magnet on the lower rail, target 108 points below the box.

Price dipped under the box at about 10:40, got roughly 50 points short of the target, and recovered. The rest of the session ranged between the box low and its midpoint. Neither target by the close, so the window shows as open until Sunday evening; the close has already decided it.

Four draws from one cell: reached, not reached, reached, not reached. Two of four against a stated 53%, and none against the lean. The section below is about what that does and does not tell you.

The week's real subject

What four draws from one cell can tell you

The half-hour window returned 28 / 53 / 19 from 440 sessions on Tuesday, Wednesday, Thursday and Friday. The hour returned 18 / 41 / 41 from 410 sessions on Wednesday, Thursday and Friday. Seven windows, two cells.

These are lookups into a fixed table. The indicator does not fit anything to the morning in front of it. A box lands in a cell, and the cell's history comes back. When the same cell comes back four days running, you get to watch the same statement tested four times.

The 53% cell went reached, not reached, reached, not reached. The 41% cell went not reached, reached, not reached. Across the seven windows the favoured target was reached three times, the opposite target never, and neither target four times. For a cell that says 53% one way, 28% the other and 19% neither, and another that says 41 / 18 / 41, that is an unremarkable set of draws, and it is meant to be read as one.

Two things are worth taking from it. First, the lean held: none of the seven resolved against it. Second, the four that went unreached were the four largest boxes of the week, which at a fixed ×0.5 meant the four furthest targets. The cell tells you which way the decided sessions went; the size of the box tells you how far price has to travel before this session counts as decided. Both were on the chart at the moment the window closed.

Seven windows prove nothing on their own, and we would not want them read as a pattern to trade. They are published because a fixed table that returns the same read four days running, and then lands two of four, is exactly what a fixed table should look like, and watching it do so in public is the point of these pages.

What this week actually shows

Five things, from the busiest Atlas-mode week so far.

  1. Seven leans, three paid, none beaten. Every Atlas-mode window this week leaned short; three reached their target and four reached neither, and not one resolved against the lean. That extends a small but clean running count: across three weeks and fifteen Atlas-mode windows, eight have been paid, seven have reached neither rail, and none has yet been marked ❌. Fifteen is far too few to call a property. It is published as a count, and the count is worth watching.
  2. The repeat cells are the week's subject. 28 / 53 / 19 four mornings running, 18 / 41 / 41 three, and outcomes that split the way a 53 and a 41 should. These are fixed lookups, not a model of the morning, and a week like this one shows it more plainly than any explanation could.
  3. Distance decided the misses. The four unreached Atlas-mode windows were the four widest boxes of the week, 215 to 366 points; the three that paid were all between 161 and 166. With the multiple fixed at ×0.5, a wide box is a far target. This is the first week at that setting, and the footnote above says what changed and why it matters for reading the record.
  4. The only cross landed on an abstain, for the third week running. Monday's half hour favoured the upside at 50 against 36, fell short of a lean, came within 25 points of the upper target and then took the lower one. The mark grades the larger share regardless; the window had offered nothing. All three ❌ marks in the thirty-window record sit on windows that had abstained.
  5. Thirty windows settle nothing. Three from seven leans paid, on a week where the cells themselves said 41 and 53. A week cannot confirm or refute a frequency measured over hundreds of sessions, and neither can three. What the record can do is accumulate in public, the bad weeks beside the good ones, which is why every week goes up.
How to check this yourself. Nothing here needs to be taken on trust. Load Atlas IB on your own NQ chart, set the window to 09:30 and the duration to 60 or 30 minutes, set the target multiple to 0.5, and scroll back to the week of 17 August 2026. The same figures will be on your screen, because they are fixed table lookups rather than anything computed from what happened next. The indicator's own General Hit Rate and Atlas Hit Rate rows will then keep score against expectation on however much history you have loaded, which is a far better test than any one week we could publish.