Sessions backtests → w/c 3 August 2026

NY AM, week commencing Monday 3 August 2026

Five NY AM sessions, each captured twice: once at 07:30 as the session opens and the tables state what they expect, and again at 11:30 once the outcome is settled. The question in every case is the same. Does NY AM take the levels London left behind, which one goes first, and does either go at all.

At a glance

Three scores, because the indicator makes three separable claims.

4 / 5
first sweep called correctly, at a mean stated 74%
3 / 5
sessions that landed the four-way branch rated highest
8 / 10
levels taken, against a mean stated 70%
0 / 5
sessions that stayed inside London's range entirely
SessionLondonPrior sweep High onlyLow onlyBothInside First sweep calledActualOutcome
Mon 3 Aug179 ptSwept low 10%52%38%0% ▼ low 85%▼ low 07:35 ✓both sides
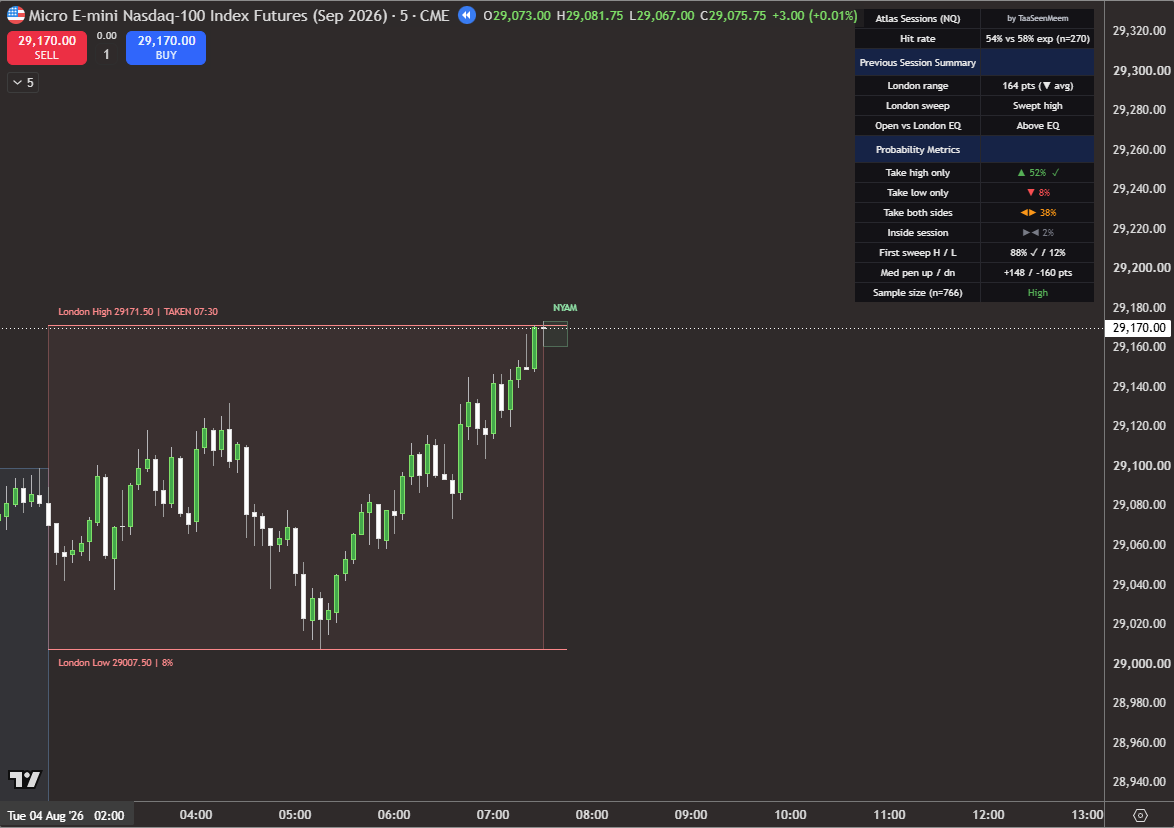
Tue 4 Aug164 ptSwept high 52%8%38%2% ▲ high 88%▲ high 07:30 ✓high only ✓
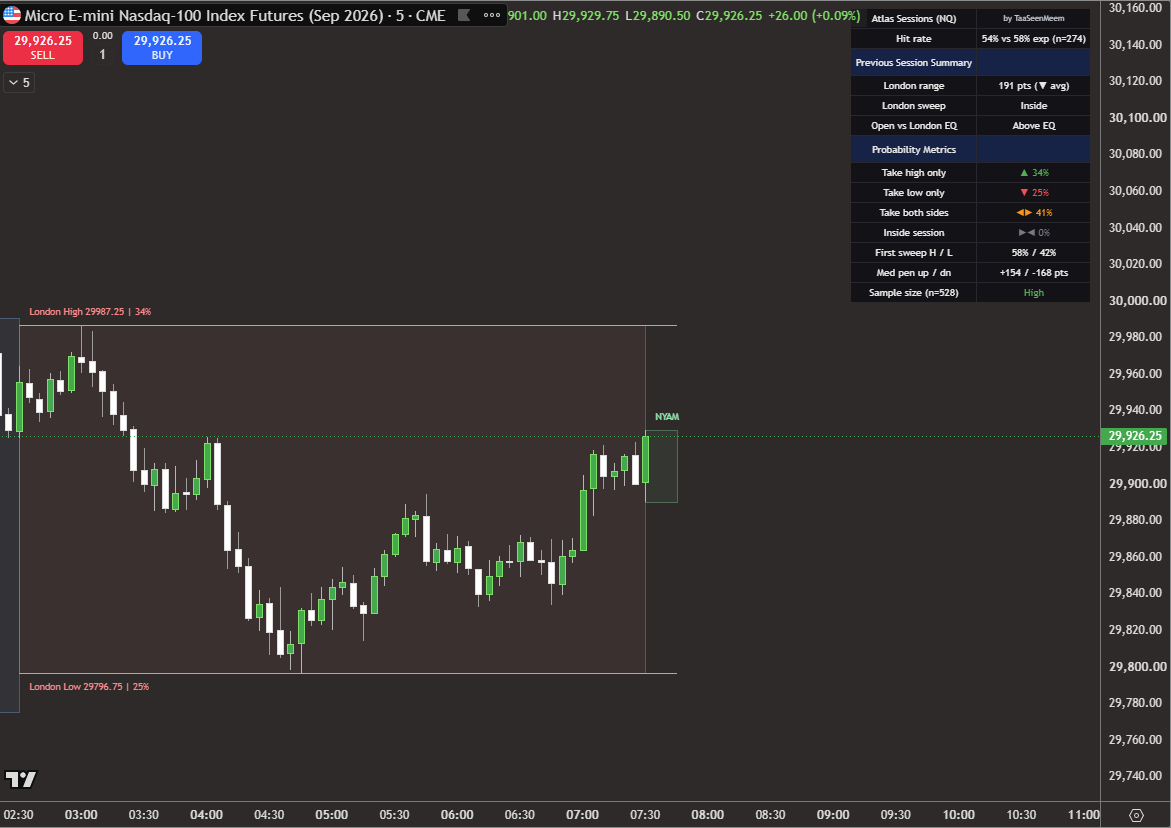
Wed 5 Aug191 ptInside 34%25%41%0% ▲ high 58%▲ high 09:30 ✓both sides ✓
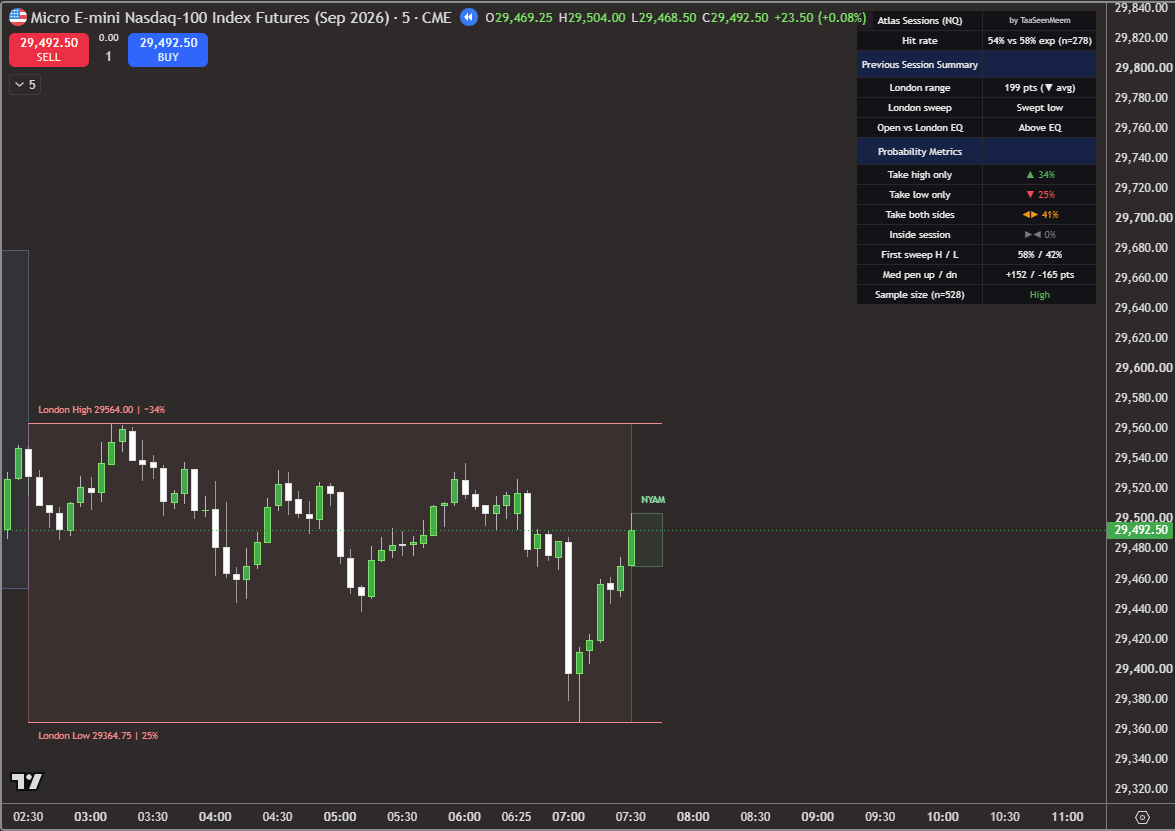
Thu 6 Aug199 ptSwept low 34%25%41%0% ▲ high 58%▼ low 09:05 ✗both sides ✓
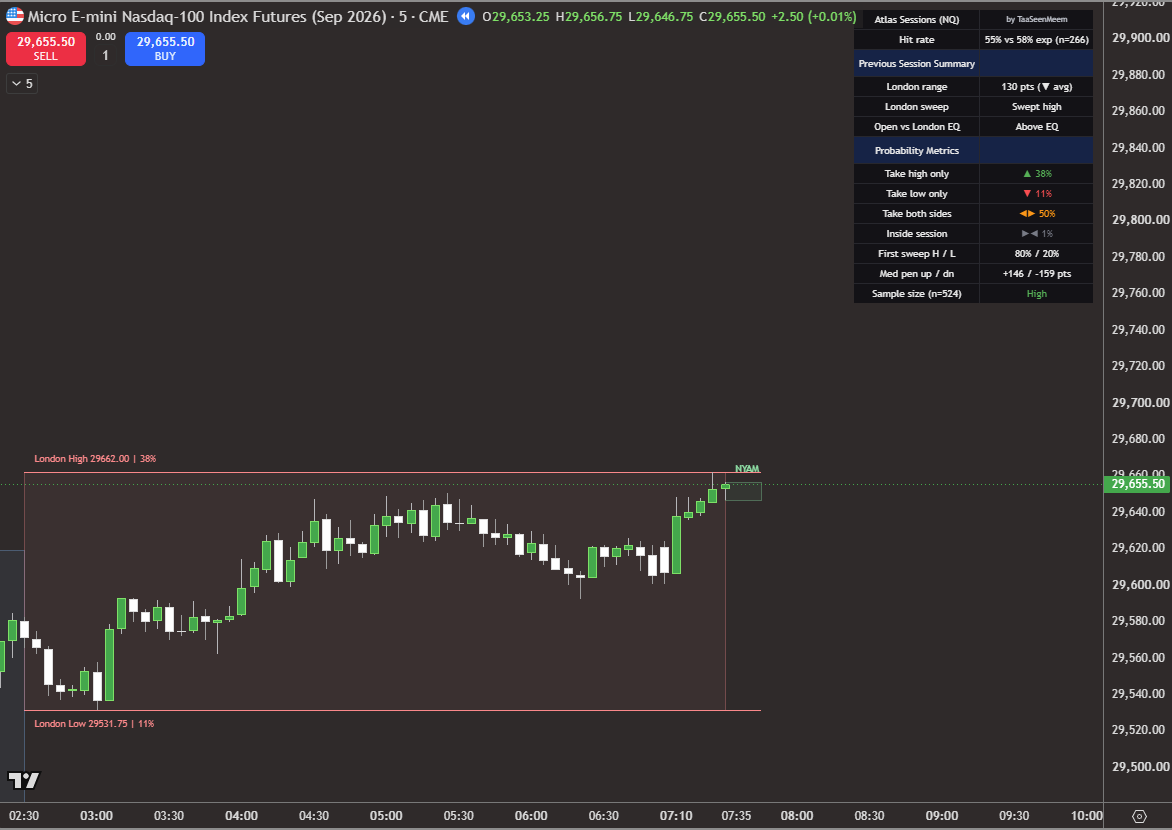
Fri 7 Aug · NFP130 ptSwept high 38%11%50%1% ▲ high 80%▲ high 07:35 ✓high only

The four share columns are the indicator's own figures, read off the status table at the session open, and they sum to 100 on every row. London is the prior session's range, which was below its own average on all five days, so this was a compressed week rather than a representative one. Gold marks the branch the tables rated highest. Times are New York time and come from the indicator's latched TAKEN stamp, not from reading the chart.

None of this week was in the sample. The Atlas Sessions tables were measured on NQ history ending 27 July 2026. Every session below happened afterwards. The percentages are fixed lookups, so the figures shown here are exactly what a live user saw at 07:30.
Every chart here is a 5-minute one, chosen for legibility and nothing else. The levels and the percentages are identical on any timeframe, because both are defined by clock time and price rather than by bars, and this was checked across 1-minute, 5-minute and 15-minute charts before release. The only thing bar size changes is the precision of the timestamp: a take stamped 07:35 here happened somewhere in the five minutes from 07:35, and a 1-minute chart would name the exact minute. Most tools that draw session levels derive them from bars instead, which is why their levels move when you change timeframe.
Read this first

What the percentages mean, and how we score them

One detail decides whether the rest of this page reads as a good week or a bad one, so it belongs before the first chart rather than in a footnote.

The number on a level is an exclusive share, not the chance that level gets taken. When the chart says London High 28645.75 | 10%, that 10% is the share of comparable sessions that took the high and left the low alone. It is the same figure as the Take high only row in the table. The probability the high is taken at all is high only plus both sides, which on that Monday was 10 + 38 = 48%. Read the label as a marginal probability and a coin flip looks like a long shot.

With that established, the indicator makes three separable claims about a session, and each is scored on its own terms.

Axis 1
First sweep

A straight two-way call. Of the sessions that touched a level at all, which side went first. Scored right or wrong against the larger of the two stated shares.

Axis 2
Four-way outcome

High only, low only, both sides, or inside. Scored by whether the branch the tables rated highest is the branch that happened. The hardest of the three, because four outcomes share 100 points between them.

Axis 3
Per side

The high and the low scored independently, each against its marginal probability. Ten events across five sessions, and the view closest to how the levels are actually traded.

Axis 2 is deliberately unforgiving. A session can land its second-most-likely branch and still score nothing, which is what happened twice this week. Axis 3 is where a session that was half right shows up as half right.

Session by session

The five NY AM sessions

Left, the session opening at 07:30. Right, the same chart at 11:30 with the outcome latched.
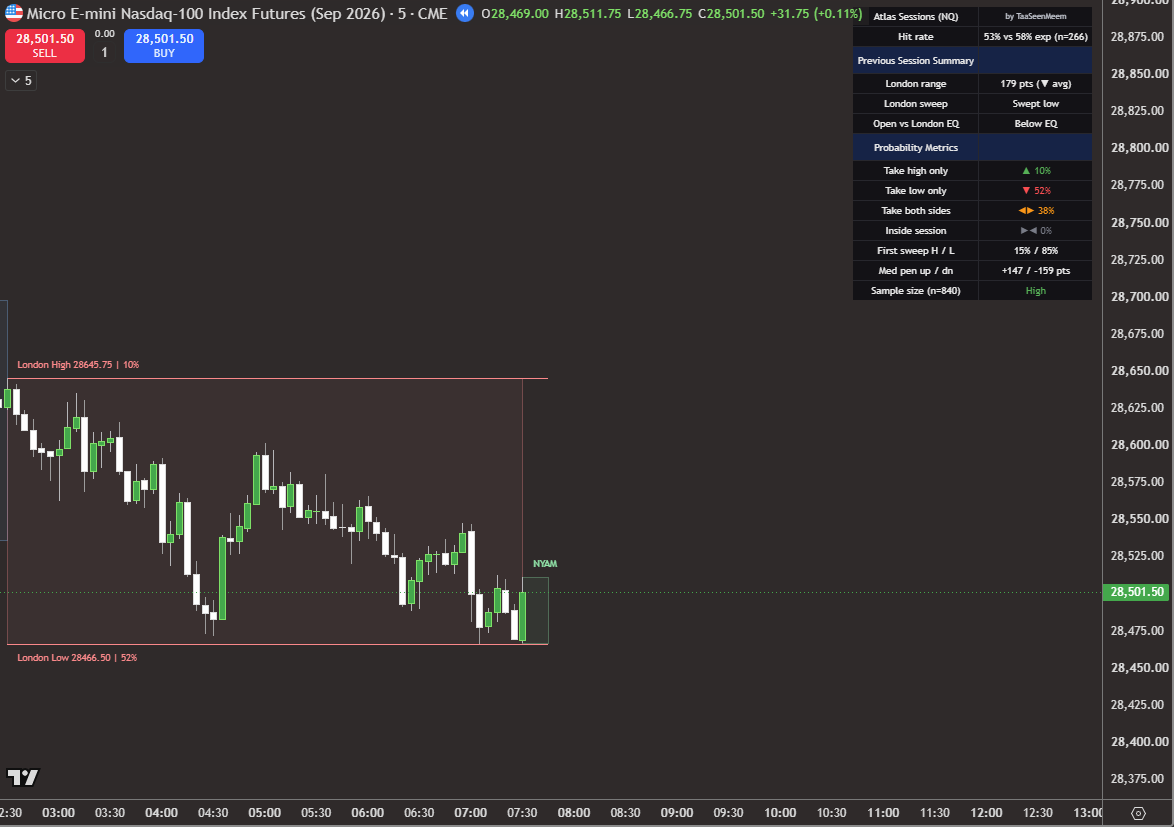
Monday 3 August 2026, NY AM opening at 07:30 on NQ: London's high above at 10 percent and London's low just below price at 52 percent, with the status table showing a 10, 52, 38, 0 split and first sweep 15 to 85 favouring the low.
07:30 open
London high 28645.75 at 10%, low 28466.50 at 52%. Price sitting on the low, below London EQ.
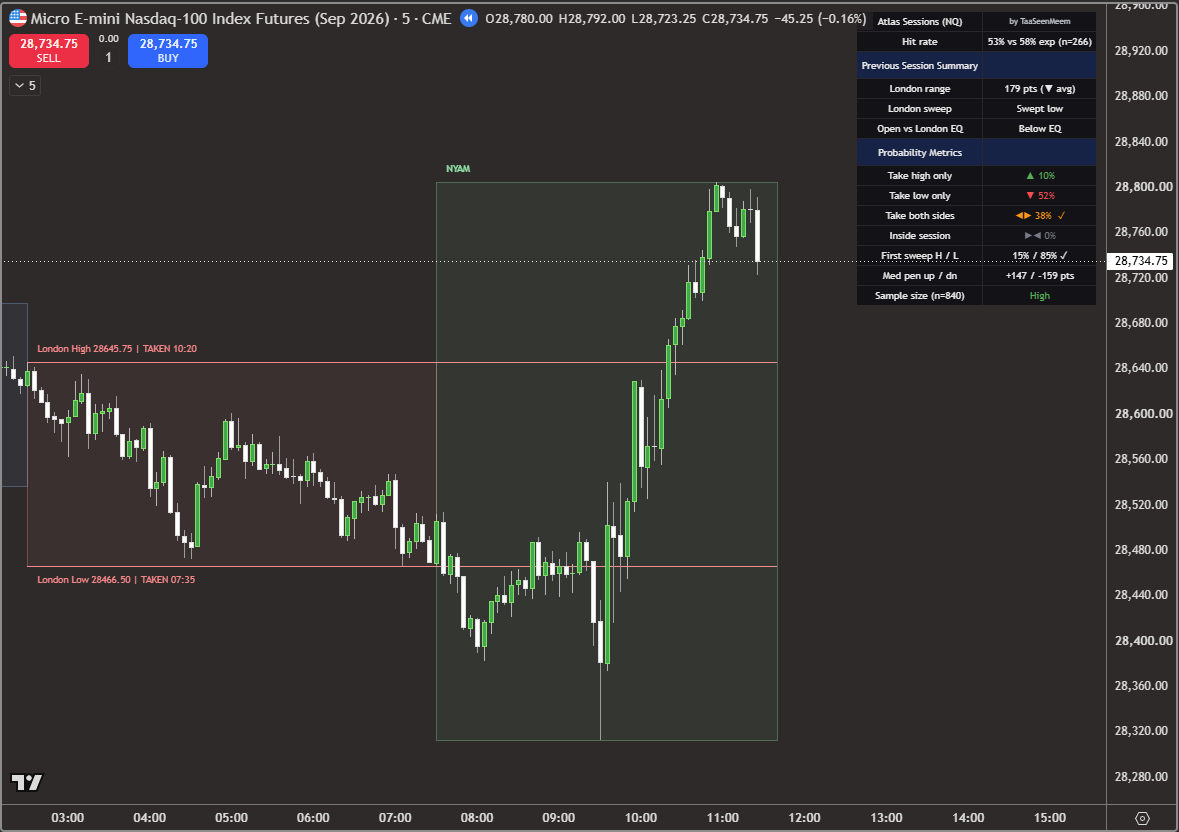
Monday 3 August 2026, NY AM at the close: both London levels latched as taken, the low at 07:35 and the high at 10:20, with ticks against take both sides 38 percent and against first sweep 85 percent low.
11:30 close
Low taken 07:35, high taken 10:20. Both sides, and the first sweep called right.
Monday 3 August

The near level went first, then the session turned and took the other one

First sweep ✓ · both sides, the 38% branch

NY AM opened with price pressed against London's low and below London EQ, which is the configuration where the tables lean hardest. The low carried a 90% marginal and an 85% call to go first. It went in five minutes.

What happened next is the interesting part. Price reversed off the low and spent the rest of the session climbing the entire London range, taking the high at 10:20. The session landed the both-sides branch at 38%, not the 52% low-only branch the tables rated highest, so it scores nothing on axis 2.

On axis 3 it was a clean two from two: the low at 90% was taken, and the high, at a genuine coin flip of 48%, was taken too. This is the session that shows why the 10% on the high label must not be read as the chance the high goes.

  • London range179 pt, below average
  • Prior sweepSwept low
  • Open vs London EQBelow EQ
  • Four-way10 / 52 / 38 / 0
  • First sweep▲ 15% · ▼ 85%
  • P(high taken)48% → taken 10:20
  • P(low taken)90% → taken 07:35
  • Samplen 840, High
Tuesday 4 August 2026, NY AM opening at 07:30 on NQ: London's high just above price at 52 percent and the low far below at 8 percent, first sweep 88 to 12 favouring the high.
07:30 open
London high 29171.50 at 52%, low 29007.50 at 8%. Price above London EQ after London swept its high.
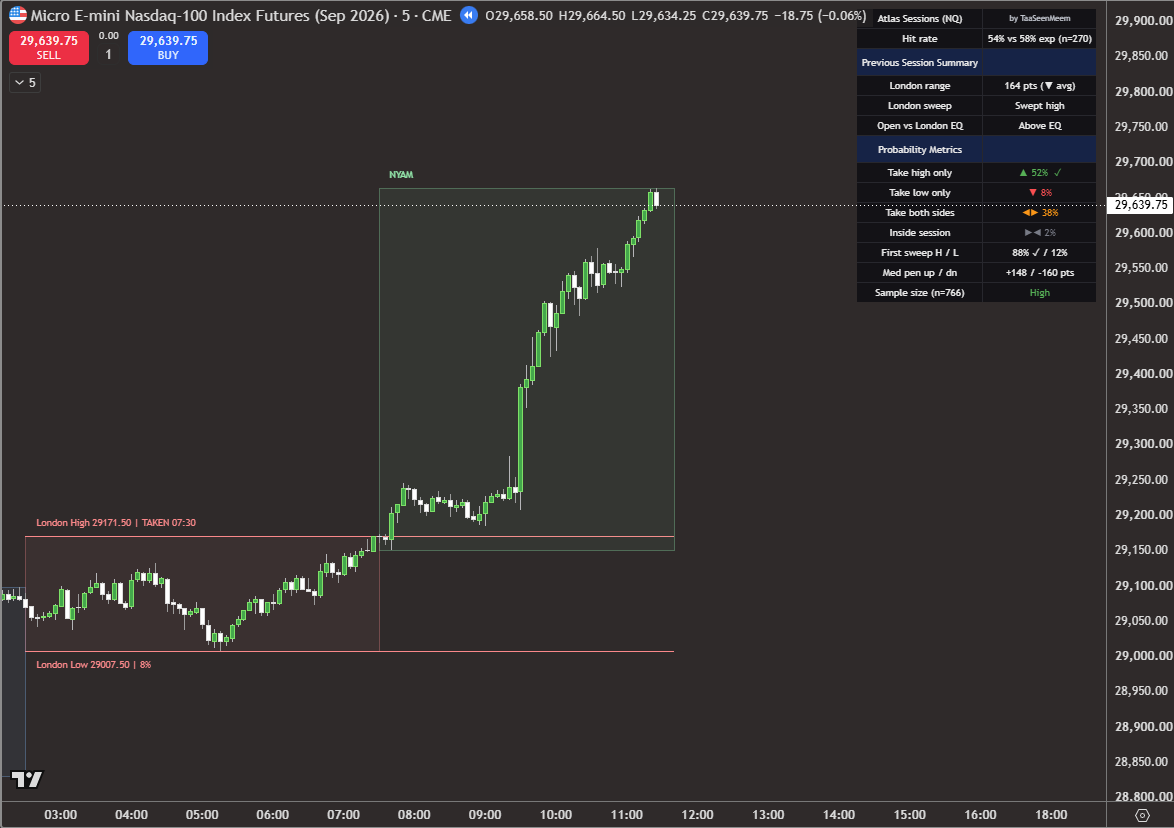
Tuesday 4 August 2026, NY AM at the close: the London high latched taken at 07:30 and the low untouched, price nearly five hundred points higher, with ticks against take high only 52 percent and first sweep 88 percent high.
11:30 close
High taken at 07:30, the low never approached. High only, and a trend for the rest of the session.
Tuesday 4 August

The cleanest session of the week, and it was over in a minute

First sweep ✓ · high only, the 52% branch ✓

The most lopsided table of the five: 52% high only against 8% low only, with an 88% call on the high going first. London had swept its own high and NY AM opened above EQ, so the level was close and the direction was already established.

The high went at 07:30, on the session's opening bar. Price then ran close to five hundred points and never came near the low, which finished the session untouched at a stated 46%.

Three from three. The first sweep was right, the modal branch was right, and both sides resolved the way their marginals implied, including the low correctly not going. A session that abstains from half the map is still making a claim about that half.

  • London range164 pt, below average
  • Prior sweepSwept high
  • Open vs London EQAbove EQ
  • Four-way52 / 8 / 38 / 2
  • First sweep▲ 88% · ▼ 12%
  • P(high taken)90% → taken 07:30
  • P(low taken)46% → not taken
  • Samplen 766, High
Wednesday 5 August 2026, NY AM opening at 07:30 on NQ: London printed an inside session, its high at 34 percent and low at 25 percent, the most balanced table of the week.
07:30 open
London high 29987.25 at 34%, low 29796.75 at 25%. London itself printed an inside session.
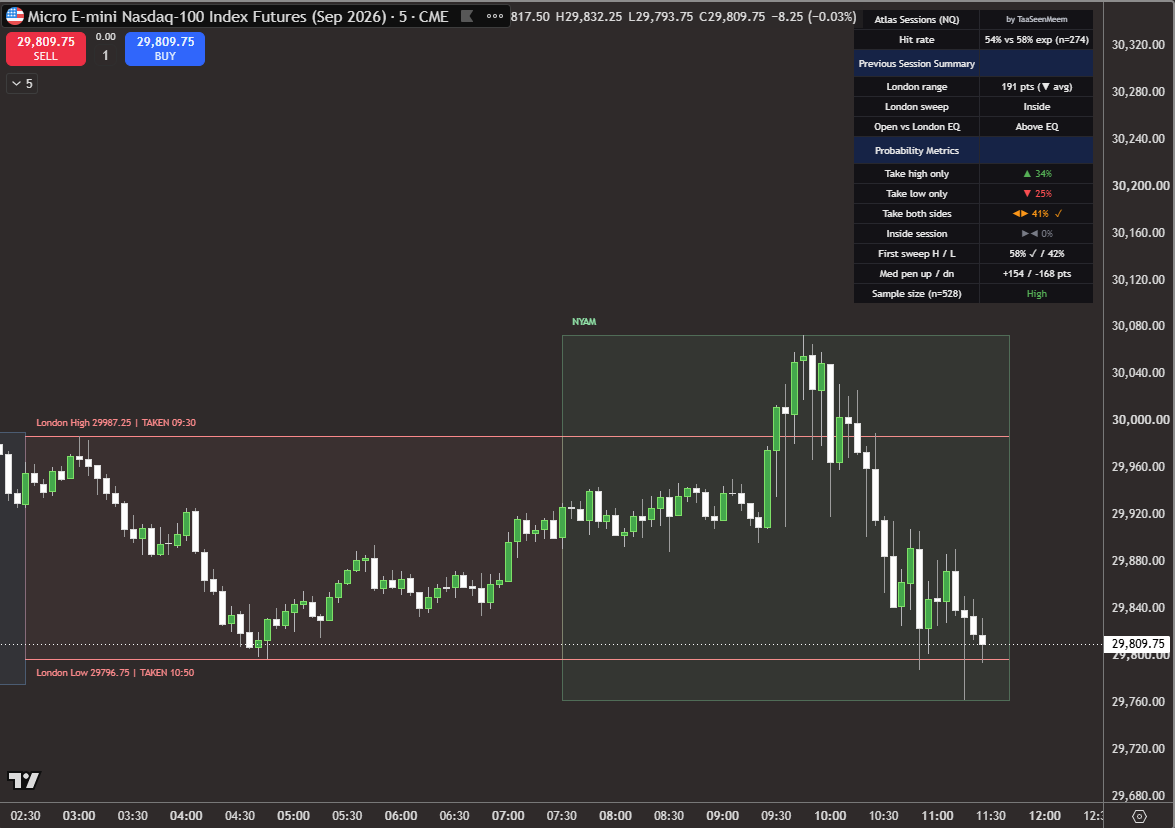
Wednesday 5 August 2026, NY AM at the close: high taken at 09:30 and low taken at 10:50, with ticks against take both sides 41 percent and first sweep 58 percent high.
11:30 close
High taken 09:30 at the cash open, low taken 10:50. Both sides, in the called order.
Wednesday 5 August

Both sides, in the order the table put them

First sweep ✓ · both sides, the 41% branch ✓

The most balanced reading of the week, and the one with least to say: 34 / 25 / 41 / 0, with the four-way spread across three live branches and a first sweep call of only 58%. London had printed an inside session, so neither level had momentum behind it.

Price drifted for the first two hours, then took the high at 09:30, the cash open to the minute, before reversing hard and taking the low at 10:50.

Three from three again, but earned differently. The modal branch here was both sides at 41%, a genuinely weak favourite, and it landed. The first sweep at 58% was barely a lean and it was right.

  • London range191 pt, below average
  • Prior sweepInside
  • Open vs London EQAbove EQ
  • Four-way34 / 25 / 41 / 0
  • First sweep▲ 58% · ▼ 42%
  • P(high taken)75% → taken 09:30
  • P(low taken)66% → taken 10:50
  • Samplen 528, High
Thursday 6 August 2026, NY AM opening at 07:30 on NQ: an identical status table to Wednesday, 34 percent high only, 25 percent low only, 41 percent both, first sweep 58 to 42.
07:30 open
London high 29564.00 at 34%, low 29364.75 at 25%. An identical table to Wednesday's.
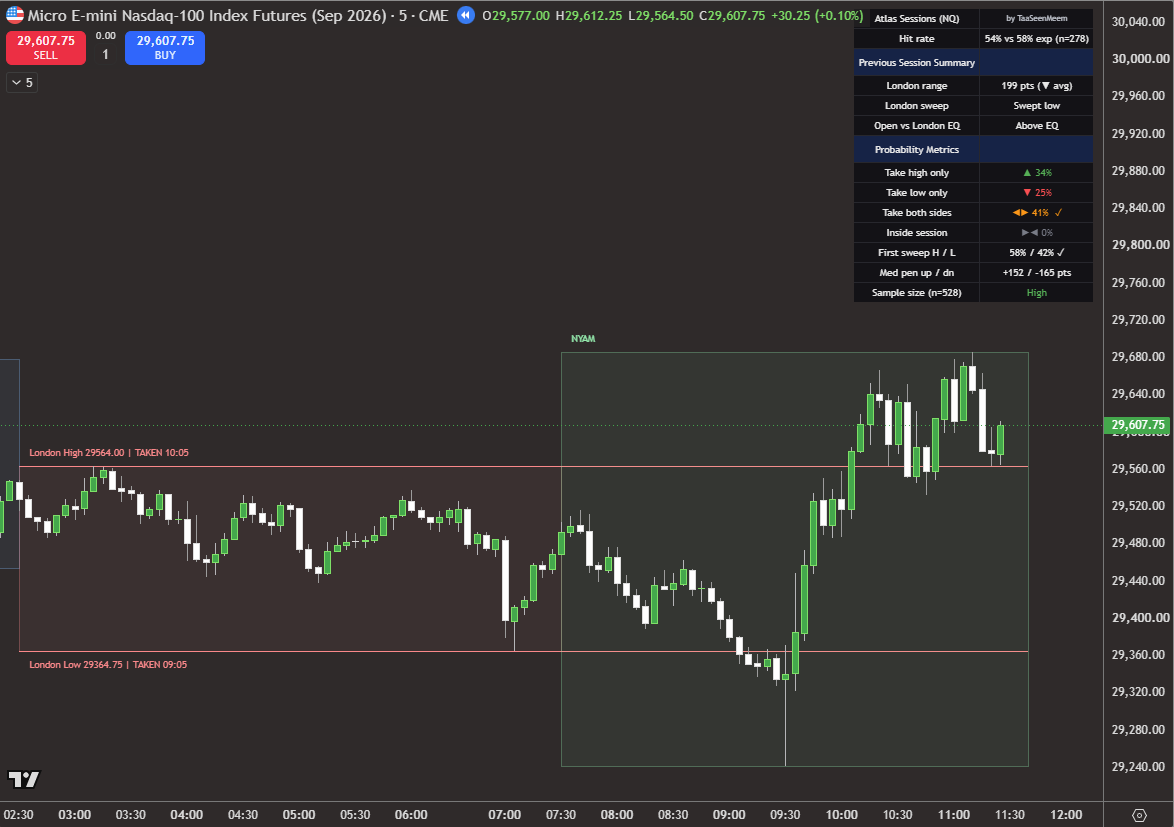
Thursday 6 August 2026, NY AM at the close: low taken at 09:05 and high taken at 10:05, so both sides went but in the opposite order to the call, with the tick on the 42 percent low side of first sweep.
11:30 close
Low taken 09:05, high taken 10:05. Same branch as Wednesday, opposite order.
Thursday 6 August

The same forecast as Wednesday, and the week's only miss

First sweep ✗ · both sides, the 41% branch ✓

Thursday returned a table identical to Wednesday's, down to the sample size: 34 / 25 / 41 / 0, first sweep 58 / 42, n 528. Two different days, different London ranges, same context bin, same answer. That is a lookup behaving like a lookup, and it is worth more than any single week's score.

The branch was right again, both sides at 41%. The order was not. The low went first at 09:05, the high followed at 10:05, and the 58% call on the high is the week's single miss on axis 1.

It is the right place for a miss to land. Of the five first-sweep calls, this was tied for the weakest, and a set of forecasts where the 58% calls never missed would be harder to believe than one where they sometimes do.

  • London range199 pt, below average
  • Prior sweepSwept low
  • Open vs London EQAbove EQ
  • Four-way34 / 25 / 41 / 0
  • First sweep▲ 58% · ▼ 42%
  • P(high taken)75% → taken 10:05
  • P(low taken)66% → taken 09:05
  • Samplen 528, High
Friday 7 August 2026 payrolls day, NY AM opening at 07:30 on NQ: London's high close above at 38 percent, the low well below at 11 percent, both sides rated highest at 50 percent.
07:30 open
London high 29662.00 at 38%, low 29531.75 at 11%. An hour before the payrolls release.
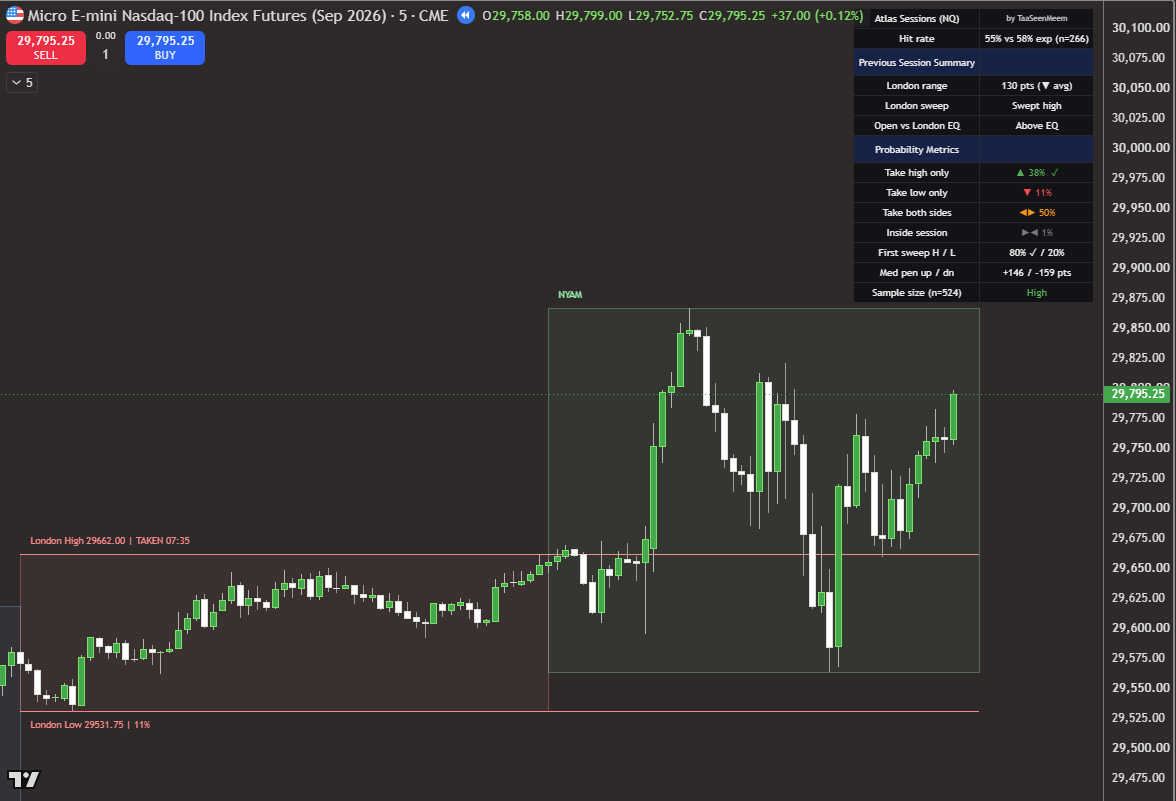
Friday 7 August 2026, NY AM at the close: the London high latched taken at 07:35 and the low untouched through a volatile payrolls session, with ticks against take high only 38 percent and first sweep 80 percent high.
11:30 close
High taken 07:35, before the release. The low held all session despite the volatility.
Friday 7 August · Non-Farm Payrolls

The high went before the number, and the low survived it

First sweep ✓ · high only, against a 50% both-sides favourite

The narrowest London of the week at 130 points, with the high close above price and an 80% call that it would go first. It went at 07:35, fifty-five minutes before the payrolls release, which is a useful reminder that the session opens long before the headline event.

Axis 2 is the miss here. The tables rated both sides at 50%, and with a release of that size inside the window it is easy to see why. But the low, 131 points below the high on the week's tightest range, held for the whole session. The day landed the 38% high-only branch instead.

Axis 3 splits it honestly: the high at 88% was taken, the low at 61% was not. One from two, on a day the four-way score records as a straight failure.

  • London range130 pt, below average
  • Prior sweepSwept high
  • Open vs London EQAbove EQ
  • Four-way38 / 11 / 50 / 1
  • First sweep▲ 80% · ▼ 20%
  • P(high taken)88% → taken 07:35
  • P(low taken)61% → not taken
  • Samplen 524, High

What this week actually shows

Four things, and the third one is the reason to publish a week like this at all.

  1. The three axes disagree, and that is the point of having three. Friday scores as a failure on the four-way and as one from two per side. Monday scores nothing on the four-way and two from two per side. A single headline number would have hidden both. If you trade one level at a time, axis 3 is your column.
  2. Wednesday and Thursday returned the same forecast from different days. Identical shares, identical first-sweep split, identical sample. Same context bin in, same answer out. Nothing was fitted to either day, and that is checkable on your own chart.
  3. The one miss landed on the weakest call. Thursday's first sweep was rated 58%, tied for the least confident of the five, and it is the one that went wrong. Forecasts that only ever miss on their weak calls are behaving; forecasts that never miss at all are usually being marked by whoever made them.
  4. Five sessions settle nothing. Ten level events against frequencies measured over hundreds of sessions cannot confirm or refute anything, and the indicator's own realised versus expected row read 53% to 55% against an expected 58% all week, which is slightly behind. The record is worth something once it accumulates. One week of it is worth reading, not relying on.
How to check this yourself. Load Atlas Sessions on your own NQ chart, set it to any timeframe you like, and scroll back to the week of 3 August 2026. The levels and the percentages will be the ones printed above, because they are fixed table lookups rather than anything computed from what happened next. The indicator's own hit-rate row will then keep score against expectation over however much history you have loaded, which is a far better test than any five sessions we could publish.