Morning by morning
Open capture on the left, close capture on the right. Click any chart to enlarge.
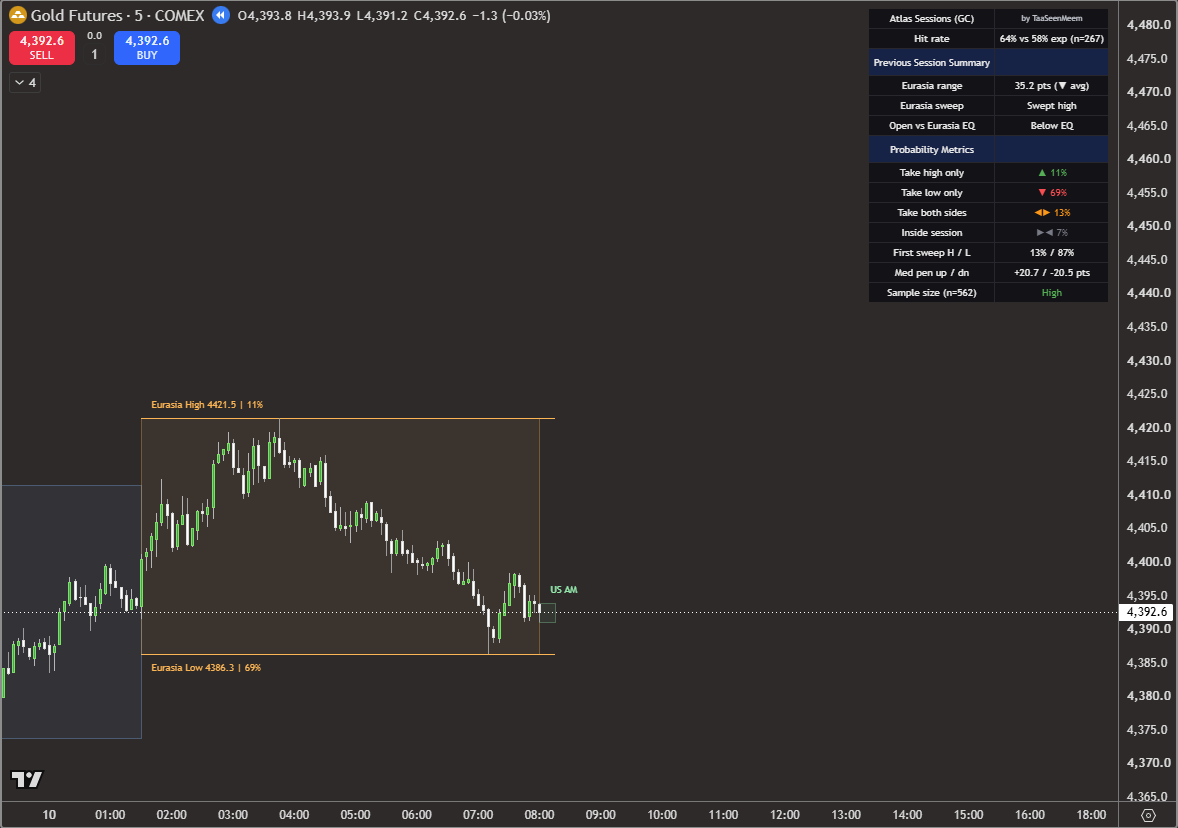
Eurasia high 4421.5 at 11%, low 4386.3 at 69%. Price below Eurasia EQ after Eurasia swept its own high.
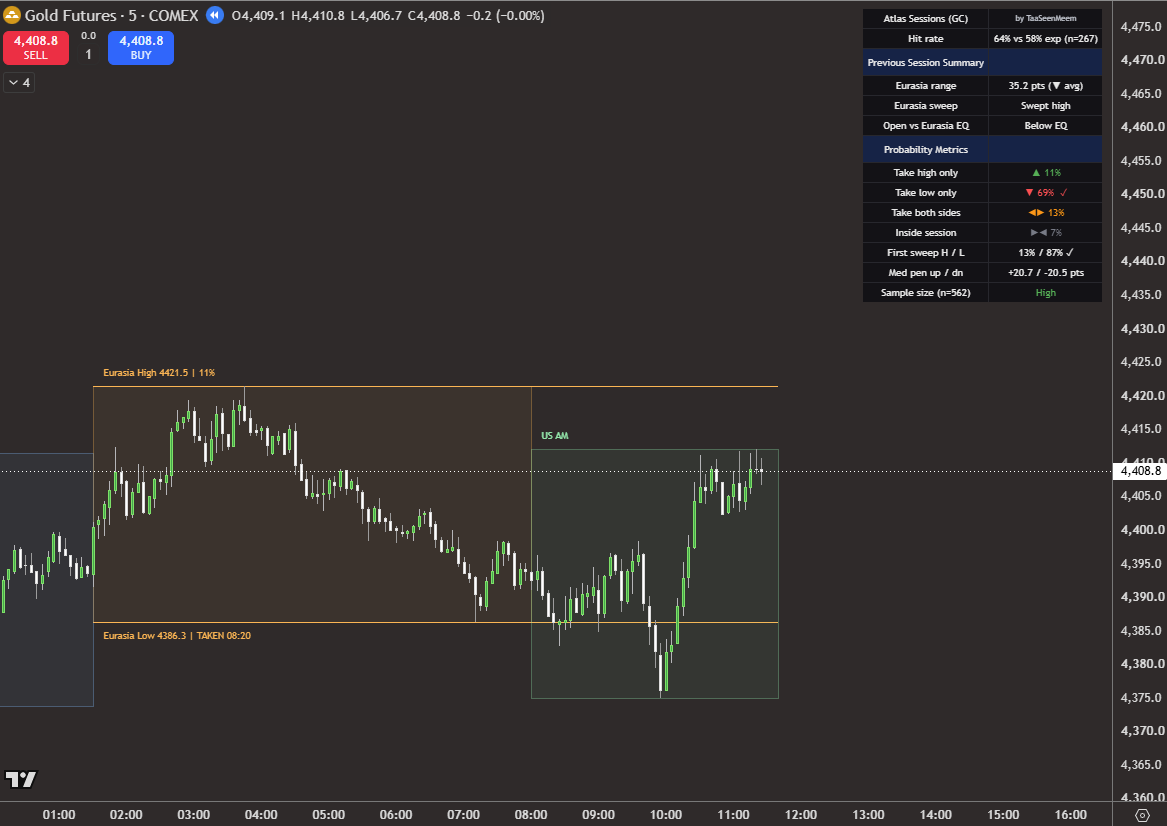
Low taken 08:20, high never approached. Low only, the rated favourite at 69%.
The near side went, and nothing else did
First sweep ✓ · modal branch ✓ · low only, as ratedEurasia swept its own high overnight and then handed US AM a session opening below Eurasia EQ, which puts the low nearer. The tables read that correctly: 87% on the low going first, and it went at 08:20.
After that the session turned and spent three hours climbing back through the middle of Eurasia's range without ever threatening the high, thirty-five points above. Low only at 69% was the favourite and it landed, so the morning scores on both axes.
Axis 3 splits one from two: the low at 82% went, the high at 24% did not. Both resolved the way their marginals said they should.
- Eurasia range35.2 pt, below average
- Prior sweepSwept high
- Open vs Eurasia EQBelow EQ
- Four-way11 / 69 / 13 / 7
- First sweep▲ 13% · ▼ 87%
- P(high taken)24% → not taken
- P(low taken)82% → taken 08:20
- Samplen 562, High
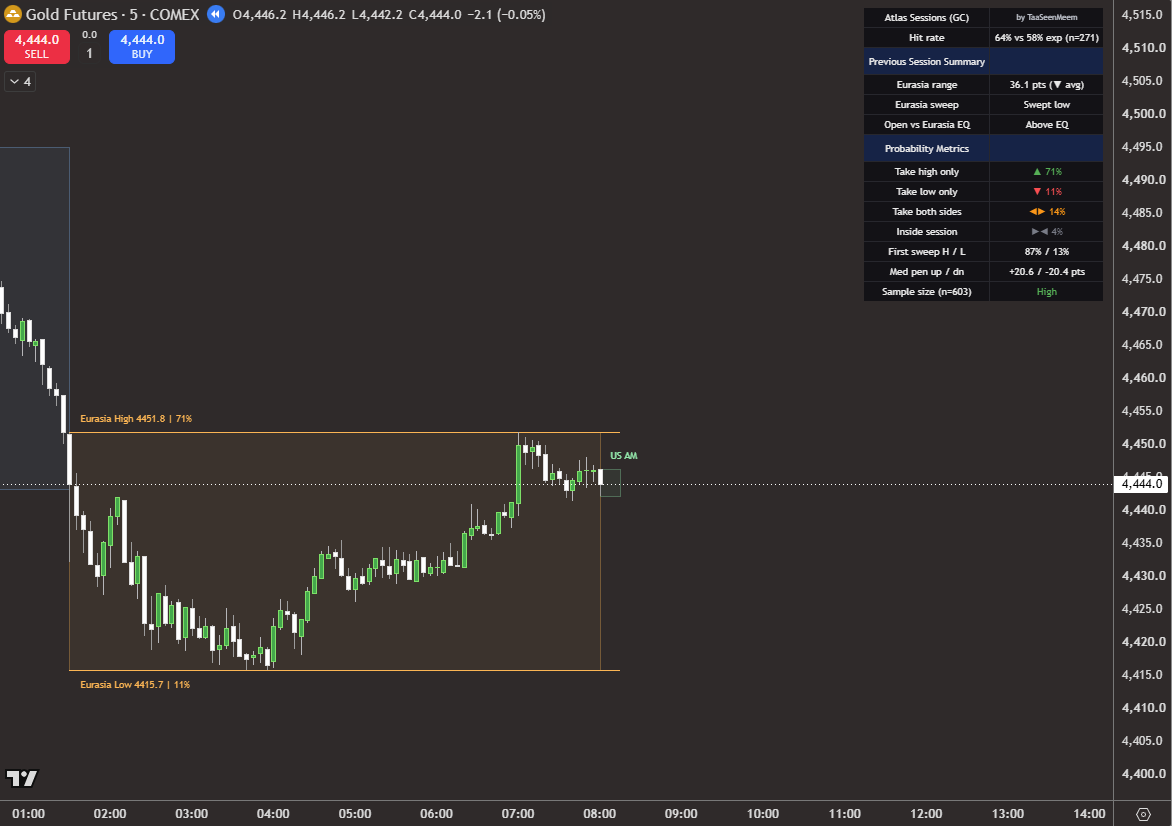
Eurasia high 4451.8 at 71%, low 4415.7 at 11%. Price above Eurasia EQ after Eurasia swept its own low.
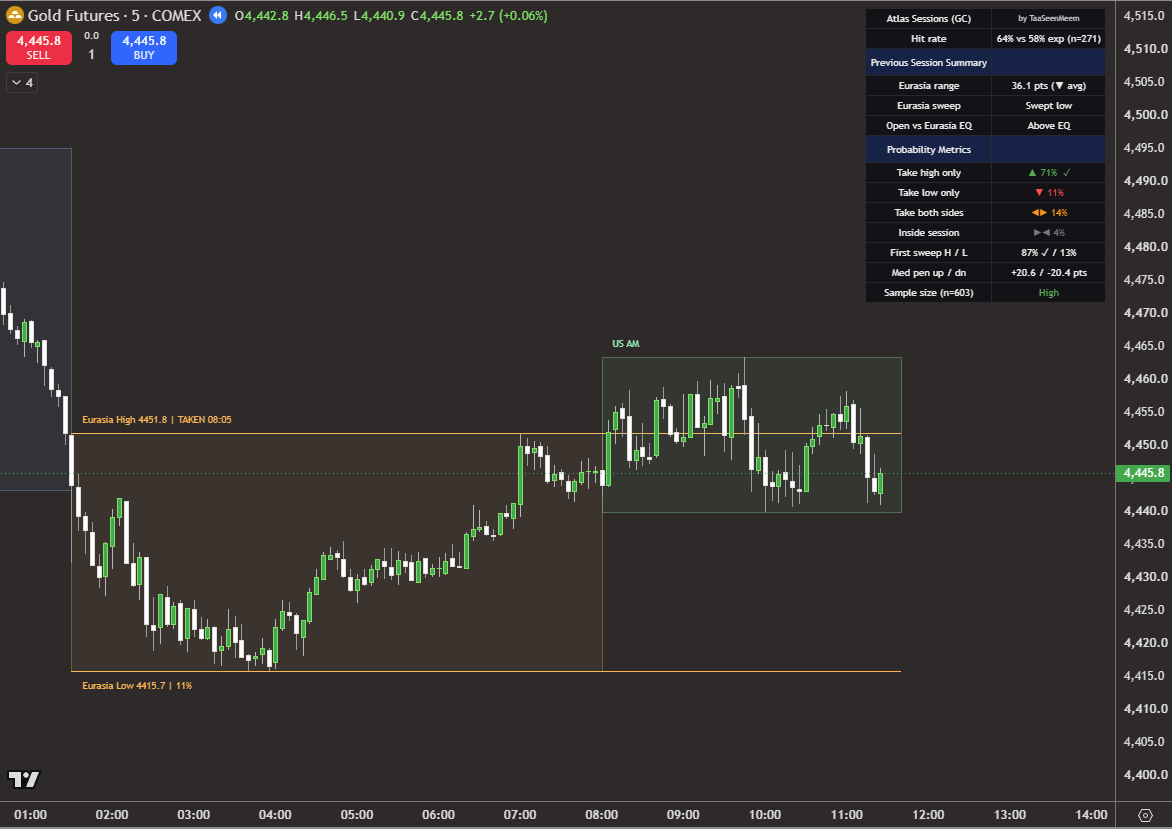
High taken 08:05, low never reached. High only, the rated favourite at 71%.
A mirror of Monday, and the tables turned with it
First sweep ✓ · modal branch ✓ · high only, as ratedThe exact inverse of Monday, and worth putting side by side. Eurasia swept its low this time, price opened above EQ, and the whole table flipped: 71% on high only where Monday had 69% on low only, and 87% on the high going first where Monday had 87% on the low.
It went at 08:05, five minutes into the session. Price then spent the rest of the morning well above the low, which sat thirty-six points below and was never in question at 25%.
This is what the tables are: a lookup on the previous session's geometry. Two mornings with opposite setups returned opposite forecasts of near-identical confidence, and both landed.
- Eurasia range36.1 pt, below average
- Prior sweepSwept low
- Open vs Eurasia EQAbove EQ
- Four-way71 / 11 / 14 / 4
- First sweep▲ 87% · ▼ 13%
- P(high taken)85% → taken 08:05
- P(low taken)25% → not taken
- Samplen 603, High
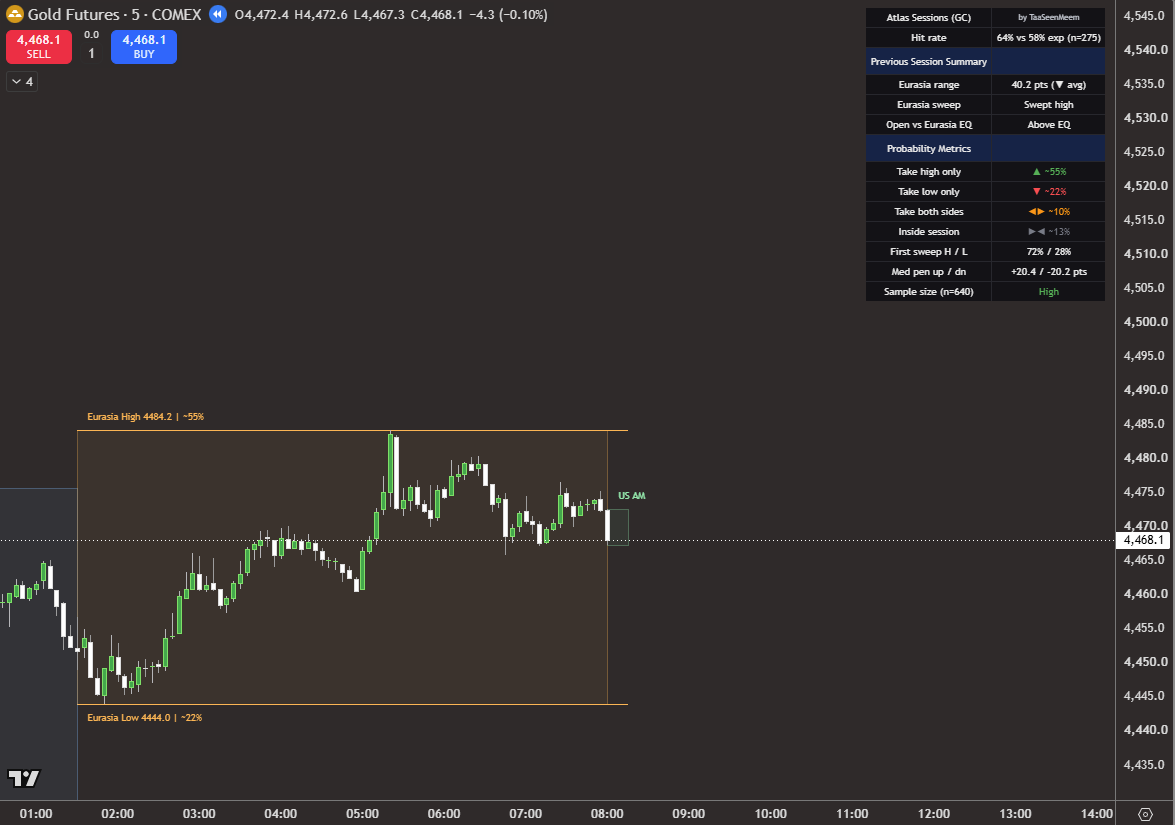
Eurasia high 4484.2 at ~55%, low 4444.0 at ~22%. Both shares era-flagged. Price above Eurasia EQ.
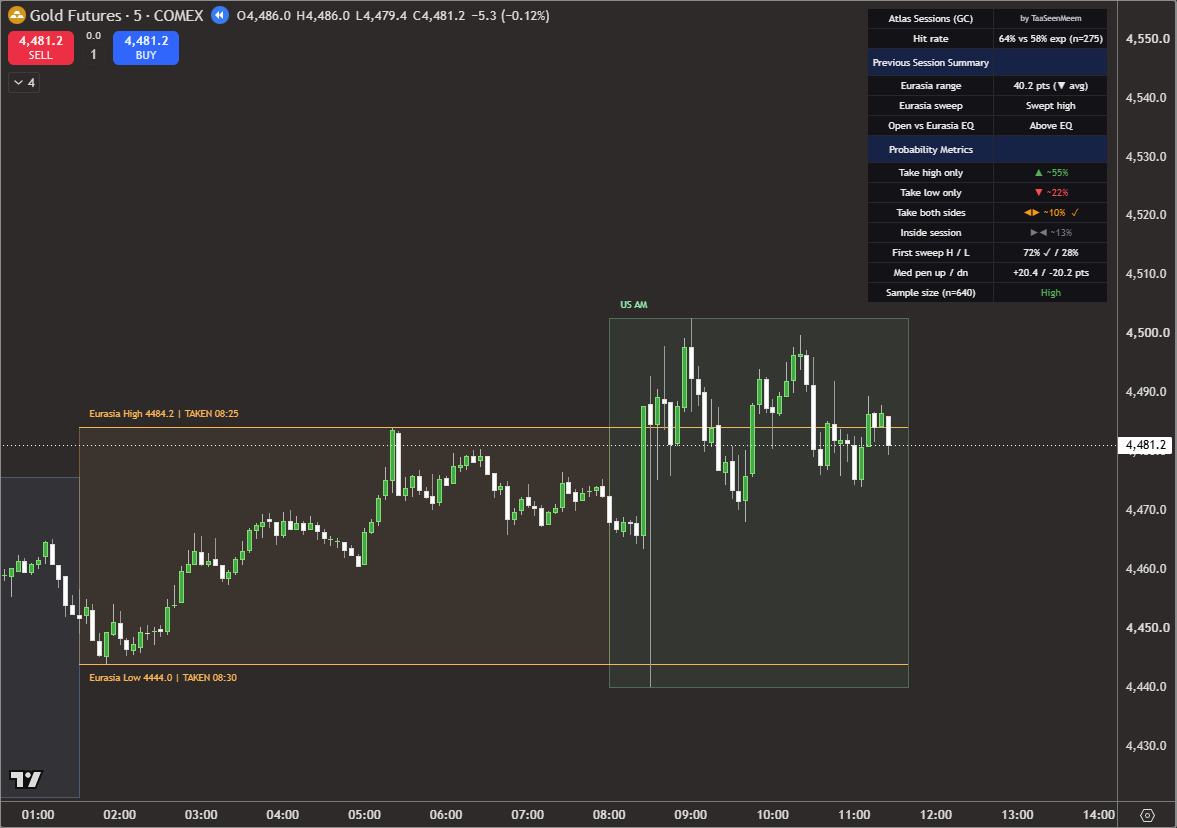
High taken 08:25, low taken 08:30. Both sides, the second-smallest share on the table.
Both sides on CPI day, one five minutes early and one on the print
First sweep ✓ · modal branch ✗ · both sides, rated ~10%🔴 CPI · 08:30 ETCore CPI and CPI released at 08:30 ET, thirty minutes into the session. The high went at 08:25, on the drift into the release, and the low went at 08:30, on the print itself. Five minutes apart, in opposite directions.
The tables rated both sides at roughly 10%, the second-smallest of the four branches, and that is the branch that landed. The favourite, high only at about 55%, was half right in the least useful way: the high did go, and go first, but the session did not then leave the low alone.
The first-sweep call survives intact at 72% on the high, which is the axis that asks which side goes rather than how many. It is a fair illustration of why the two axes are scored separately. The four-way branch is a statement about containment, and a release is precisely the thing that removes it.
- Eurasia range40.2 pt, below average
- Prior sweepSwept high
- Open vs Eurasia EQAbove EQ
- Four-way~55 / ~22 / ~10 / ~13
- First sweep▲ 72% · ▼ 28%
- P(high taken)65% → taken 08:25
- P(low taken)32% → taken 08:30
- Samplen 640, High
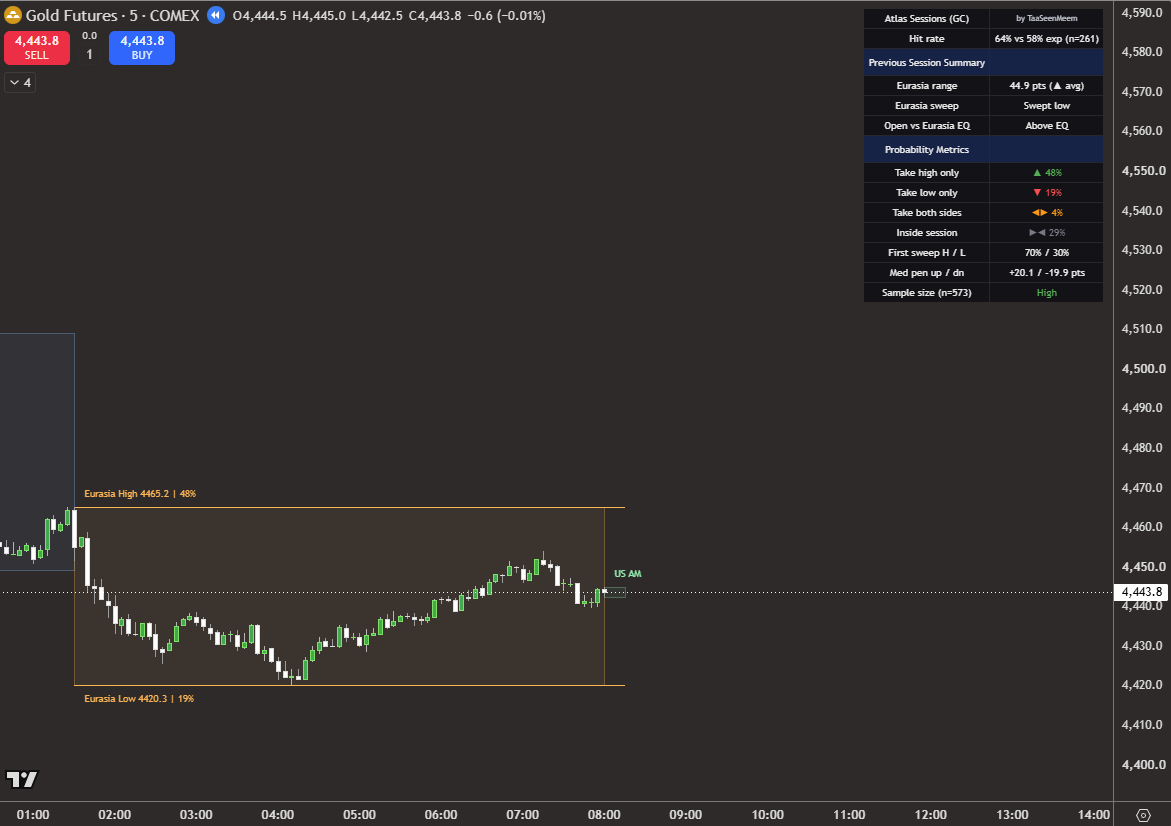
Eurasia high 4465.2 at 48%, low 4420.3 at 19%. Inside rated 29%, the week's highest.
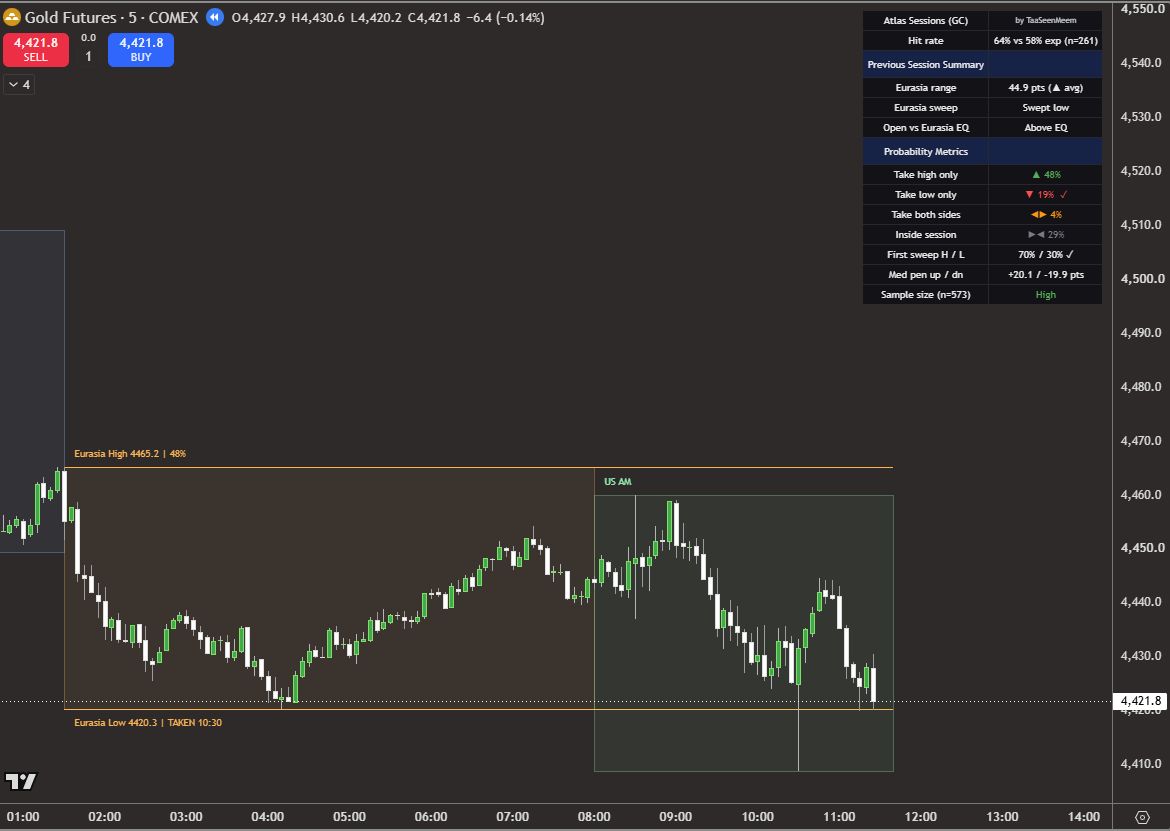
Low taken 10:30, high never approached. Low only, rated 19%.
The week's only double miss, and the release had nothing to do with it
First sweep ✗ · modal branch ✗ · low only, rated 19%🔴 PPI · 08:30 ETCore PPI and PPI released at 08:30 ET, and gold did approximately nothing with it. The session drifted lower for two hours before the low finally went at 10:30, which is not a release reaction by any reading.
Both axes miss. The tables favoured the high at 48% and on first sweep at 70%. The low went, and it was the only thing that went, on a branch rated 19%. This is the week's one genuinely bad morning and it is worth stating plainly rather than burying: a 70% call resolved the other way.
The other number on this table is the interesting one. Inside was rated 29%, the highest of the week, on the widest Eurasia range so far at 44.9 points. A wide prior session pushes both levels further away and makes containment more likely. It did not happen here, and it did not happen on any of the five mornings.
- Eurasia range44.9 pt, above average
- Prior sweepSwept low
- Open vs Eurasia EQAbove EQ
- Four-way48 / 19 / 4 / 29
- First sweep▲ 70% · ▼ 30%
- P(high taken)52% → not taken
- P(low taken)23% → taken 10:30
- Samplen 573, High
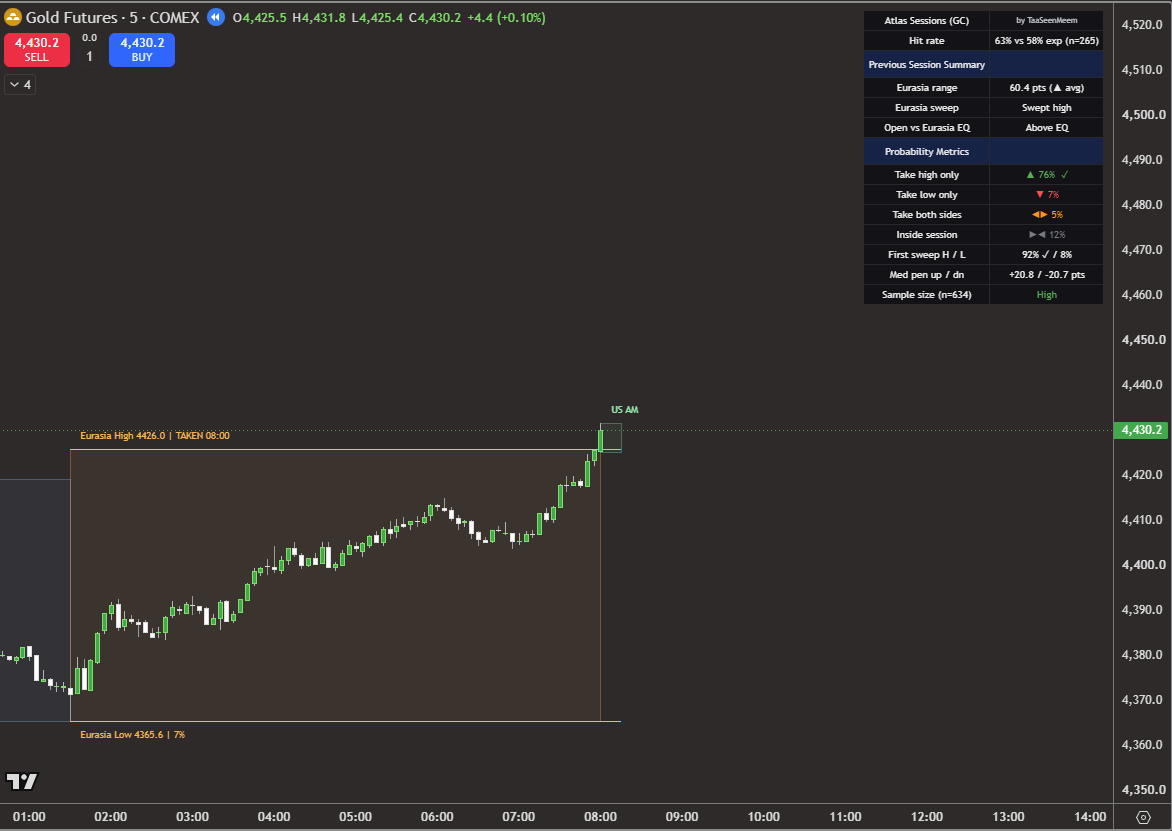
Eurasia high 4426.0, taken at 08:00 in the opening bar. Low 4365.6 at 7%, sixty points away.
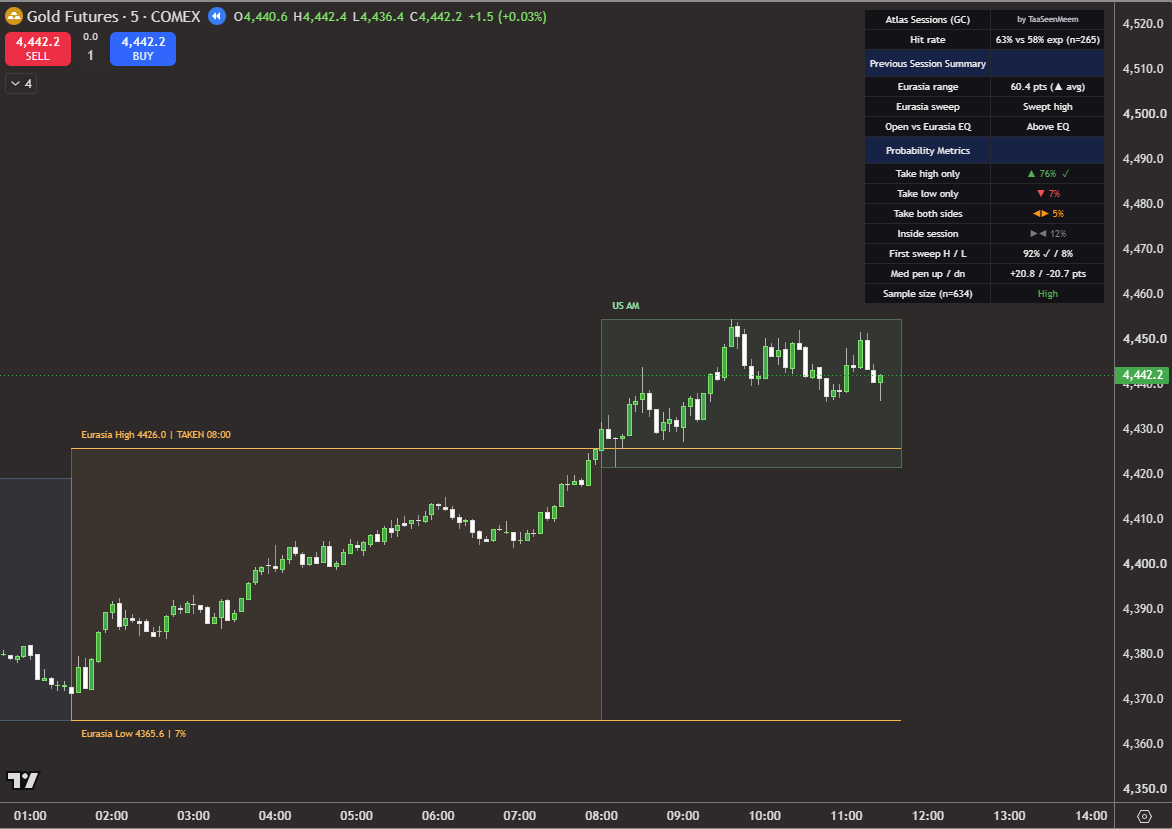
High taken 08:00, low never threatened. High only at 76%, the week's largest favourite.
The most confident call of the week resolved in the opening bar
First sweep ✓ · modal branch ✓ · high only, as ratedThe widest Eurasia range of the week at 60.4 points, well above average, and a session that opened with price already pressed against Eurasia's high. The tables put 92% on the high going first, the most confident call of the week, and 76% on high only.
It went at 08:00, in the opening bar. Price then held above it for the rest of the morning, and the low, sixty points below at 12%, was never a live question.
An easy morning, and worth being honest about why it was easy: when a level is already within touching distance at the open, a high stated probability is close to arithmetic. The mornings that test the tables are the ones like Thursday, where both levels are in play and the call has to choose.
- Eurasia range60.4 pt, above average
- Prior sweepSwept high
- Open vs Eurasia EQAbove EQ
- Four-way76 / 7 / 5 / 12
- First sweep▲ 92% · ▼ 8%
- P(high taken)81% → taken 08:00
- P(low taken)12% → not taken
- Samplen 634, High