Sessions backtests → w/c 10 August 2026

NY AM, week commencing Monday 10 August 2026

A harder week than the last one, and a more instructive one. The tables rated both sides the most likely outcome on all five mornings and were paid on two of them. It is also the week in which the same forecast appeared twice and resolved two different ways, which is the most useful thing either week has shown.

At a glance

Three scores, because the indicator makes three separable claims.

3 / 5
first sweep called correctly, at a mean stated 68%
2 / 5
sessions that landed the four-way branch rated highest
7 / 10
levels taken, against a mean stated 74%
5 / 5
mornings where both sides was the favourite, paid on two
SessionLondonPrior sweep High onlyLow onlyBothInside First sweep calledActualOutcome
Mon 10 Aug133 ptSwept high 19%30%50%1% ▼ low 66%▼ low 07:45 ✓low only
Tue 11 Aug170 ptSwept high 34%25%41%0% ▲ high 58%▼ low 09:35 ✗low only
Wed 12 Aug144 ptSwept high 38%11%50%1% ▲ high 80%▲ high 08:00 ✓high only
Thu 13 Aug84 ptInside 28%15%56%1% ▲ high 58%▼ low 08:15 ✗both sides ✓
Fri 14 Aug113 ptSwept high 38%11%50%1% ▲ high 80%▲ high 07:45 ✓both sides ✓

The four share columns are the indicator's own figures, read off the status table at the session open, and they sum to 100 on every row. Gold marks the branch the tables rated highest, which was both sides on all five mornings. London printed below its own average range on every day again, making this the tenth consecutive compressed prior session across the two weeks published so far.

None of this week was in the sample. The Atlas Sessions tables were measured on NQ history ending 27 July 2026. Every session below happened afterwards, and the percentages are fixed lookups, so the figures shown are exactly what a live user saw at 07:30.
Every chart here is a 5-minute one, chosen for legibility and nothing else. The levels and the percentages are identical on any timeframe, because both are defined by clock time and price rather than by bars, and this was checked across 1-minute, 5-minute and 15-minute charts before release. Only the precision of the timestamp follows the bar size: a take stamped 07:45 here happened somewhere in the five minutes from 07:45.
The number on a level is an exclusive share, not the chance that level gets taken. London High | 19% means 19% of comparable sessions took the high and left the low alone. The chance the high is taken at all is high only plus both sides, which on that Monday was 19 + 50 = 69%. The full explanation is on last week's page, and it matters more this week than last, because both sides was the favourite every single morning.
Session by session

The five NY AM sessions

Left, the session opening at 07:30. Right, the same chart at 11:30 with the outcome latched.
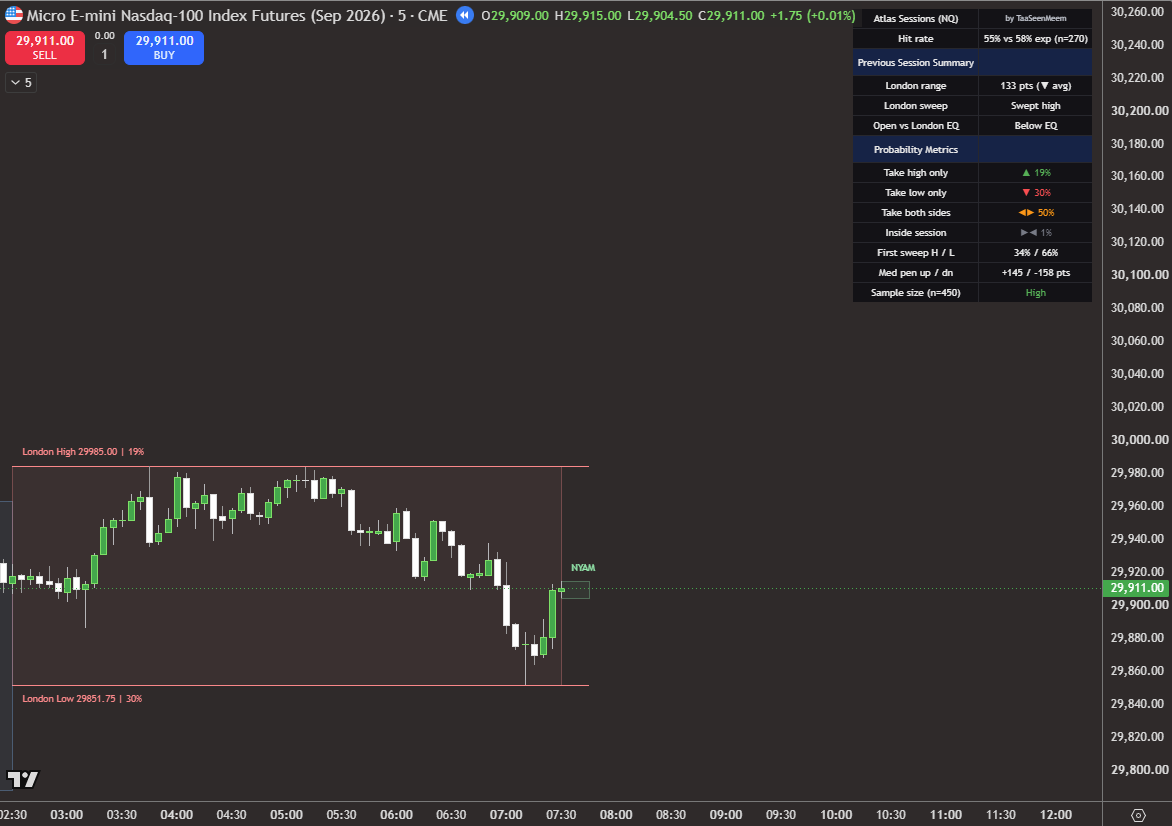
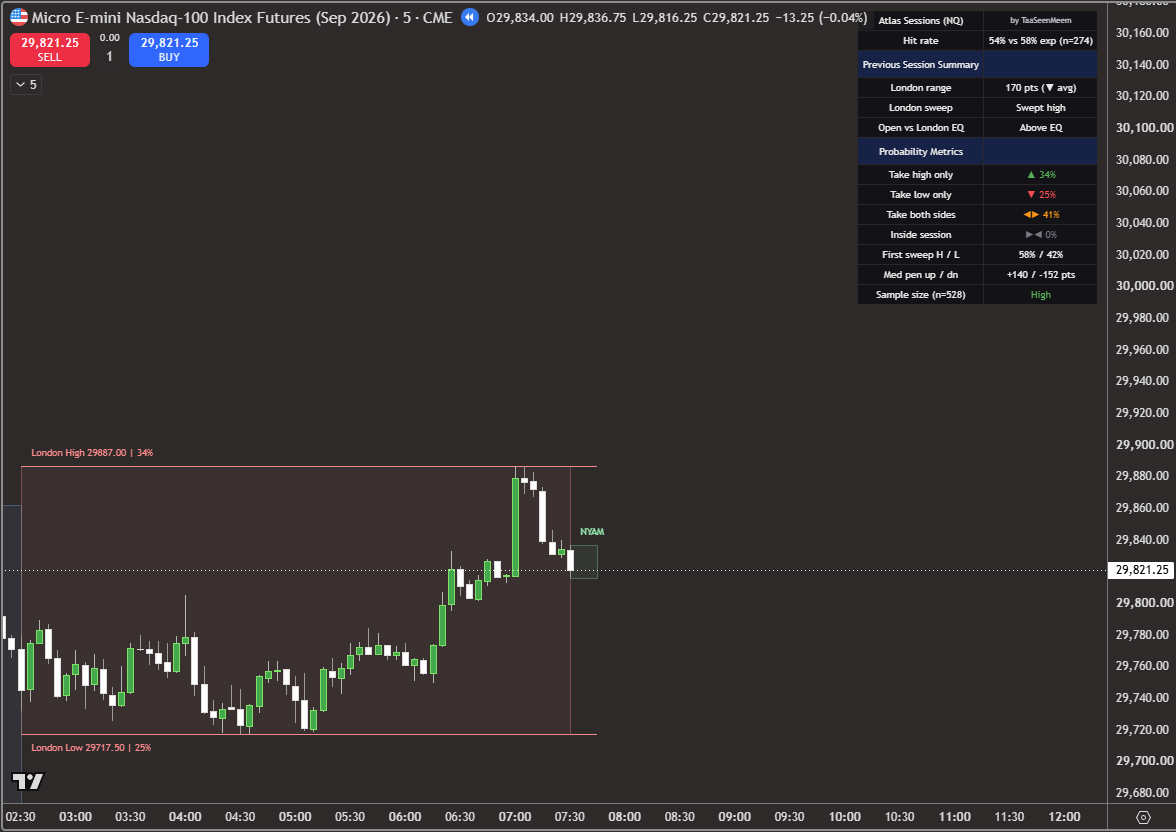
Monday 10 August 2026, NY AM opening at 07:30 on NQ: London's high well above at 19 percent and the low just below price at 30 percent, with both sides rated the favourite at 50 percent and first sweep 34 to 66 favouring the low.
07:30 open
London high 29985.00 at 19%, low 29851.75 at 30%. Price below London EQ despite London having swept its own high.
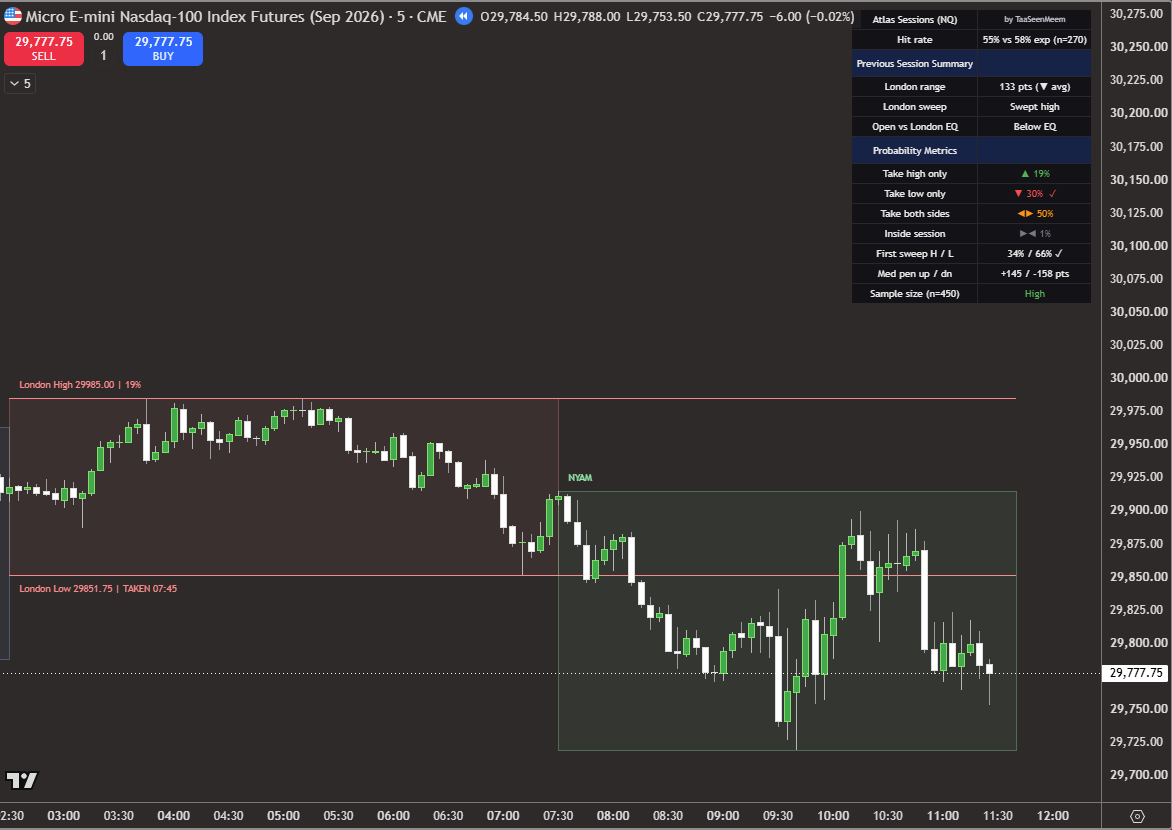
Monday 10 August 2026, NY AM at the close: the London low latched taken at 07:45 and the high untouched, price ranging sideways for the rest of the session well below the high.
11:30 close
Low taken 07:45, high never approached. Low only, and the 50% favourite did not land.
Monday 10 August

The near side went, and nothing else did

First sweep ✓ · low only, against a 50% both-sides favourite

London swept its own high overnight and then handed NY AM a session that opened below London EQ, which puts the low nearer. The tables read that correctly: 66% on the low going first, and it went at 07:45.

After that the session did nothing useful. Price spent four hours ranging between the low it had just taken and the middle of London's range, never getting within a hundred points of the high. Both sides at 50% was the favourite and it did not land, so the session scores nothing on axis 2.

Axis 3 splits it one from two: the low at 80% was taken, the high at 69% was not. That 69% is the number to watch this week, because a version of it recurs on four of the five mornings.

  • London range133 pt, below average
  • Prior sweepSwept high
  • Open vs London EQBelow EQ
  • Four-way19 / 30 / 50 / 1
  • First sweep▲ 34% · ▼ 66%
  • P(high taken)69% → not taken
  • P(low taken)80% → taken 07:45
  • Samplen 450, High
Tuesday 11 August 2026, NY AM opening at 07:30 on NQ: London's high above at 34 percent and the low below at 25 percent, both sides favoured at 41 percent, first sweep 58 to 42 favouring the high.
07:30 open
London high 29887.00 at 34%, low 29717.50 at 25%. Price above London EQ after London swept its high.
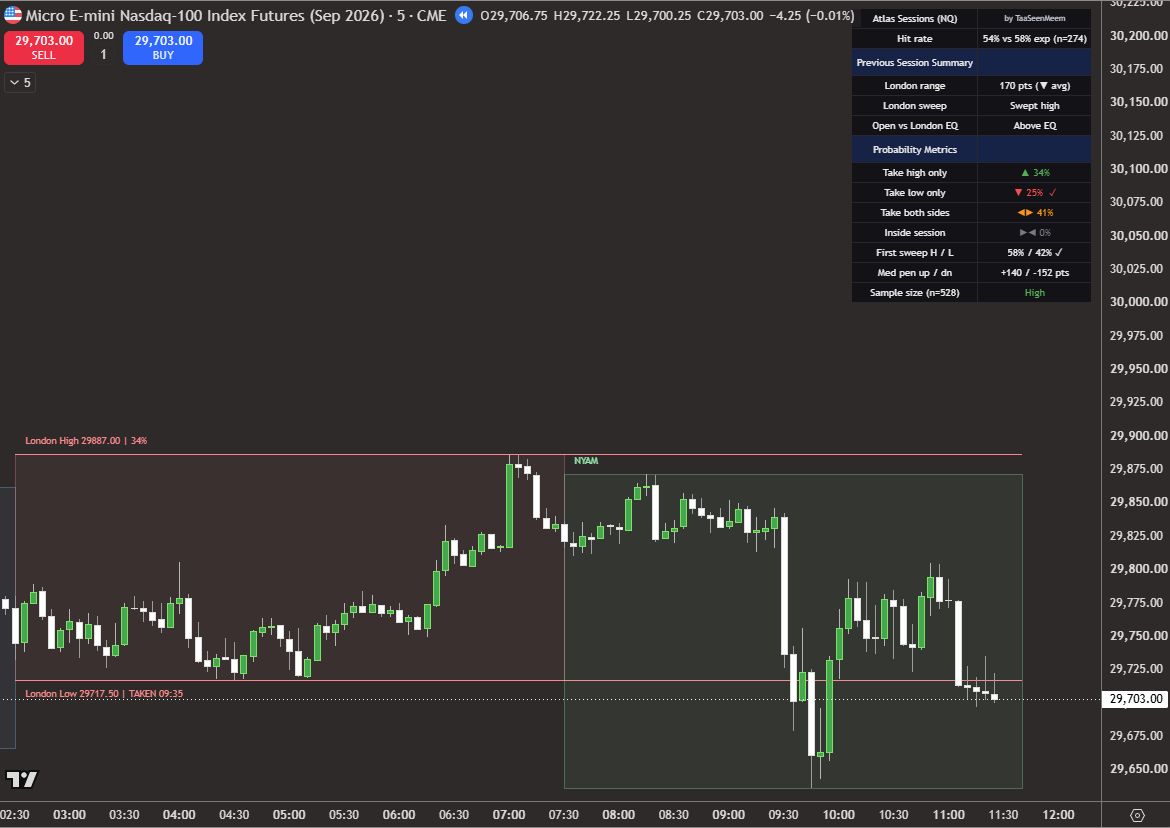
Tuesday 11 August 2026, NY AM at the close: the London low latched taken at 09:35 after a sharp drop, the high untouched all session.
11:30 close
Low taken 09:35, high never reached. The 25% branch, the smallest on the table.
Tuesday 11 August

The worst session of the two weeks published so far

First sweep ✗ · low only, the 25% branch

Everything the tables leaned on went the other way. The call was the high first at 58%; the low went first. The favourite was both sides at 41%; neither of the two most likely branches landed. What did land was low only at 25%, the smallest share on the table.

Price held above London EQ until the cash open, then dropped through the whole London range in under an hour, took the low at 09:35 and stayed down. The high, carrying a 75% marginal, was never threatened.

One from two on axis 3, zero on the other two axes. There is no reading of this session that flatters it, and a page that only published the good weeks would not be worth reading.

  • London range170 pt, below average
  • Prior sweepSwept high
  • Open vs London EQAbove EQ
  • Four-way34 / 25 / 41 / 0
  • First sweep▲ 58% · ▼ 42%
  • P(high taken)75% → not taken
  • P(low taken)66% → taken 09:35
  • Samplen 528, High
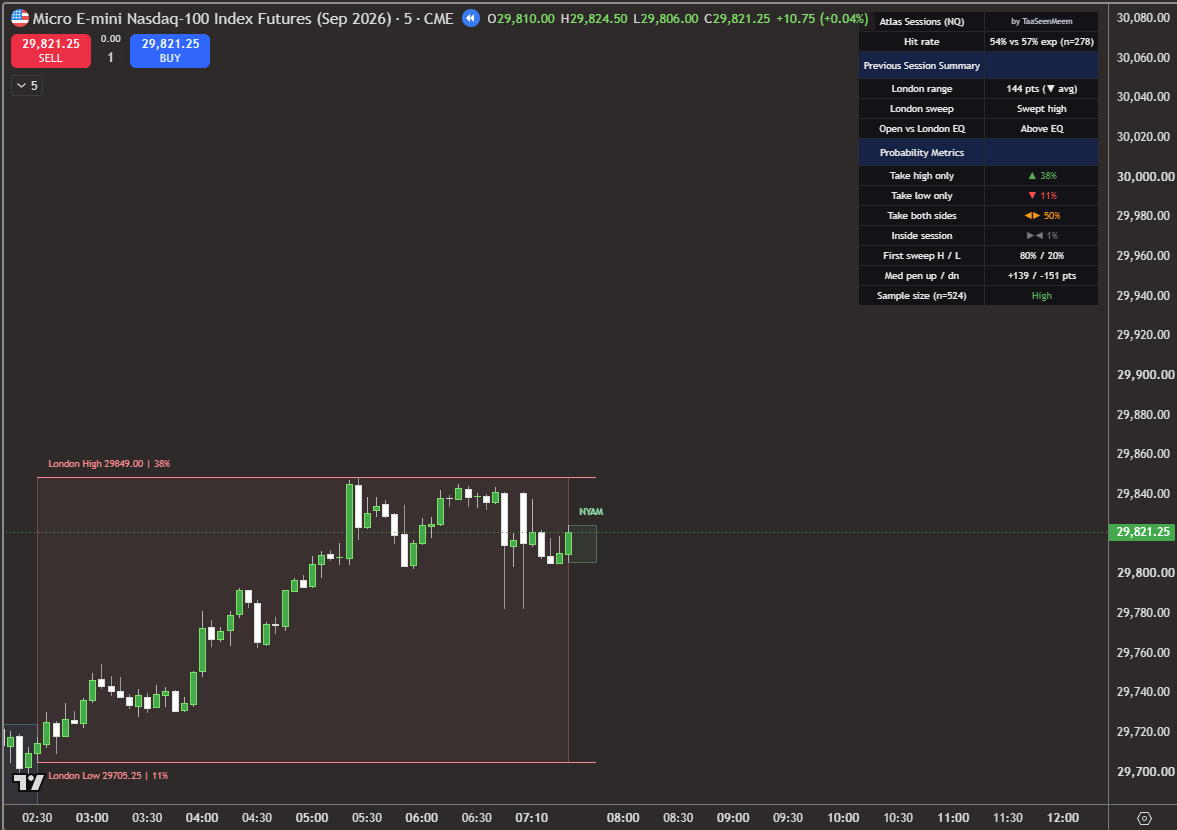
Wednesday 12 August 2026, NY AM opening at 07:30 on NQ: London's high close above price at 38 percent and the low far below at 11 percent, first sweep 80 to 20 favouring the high.
07:30 open
London high 29849.00 at 38%, low 29705.25 at 11%. Price pressed up against the high at the open.
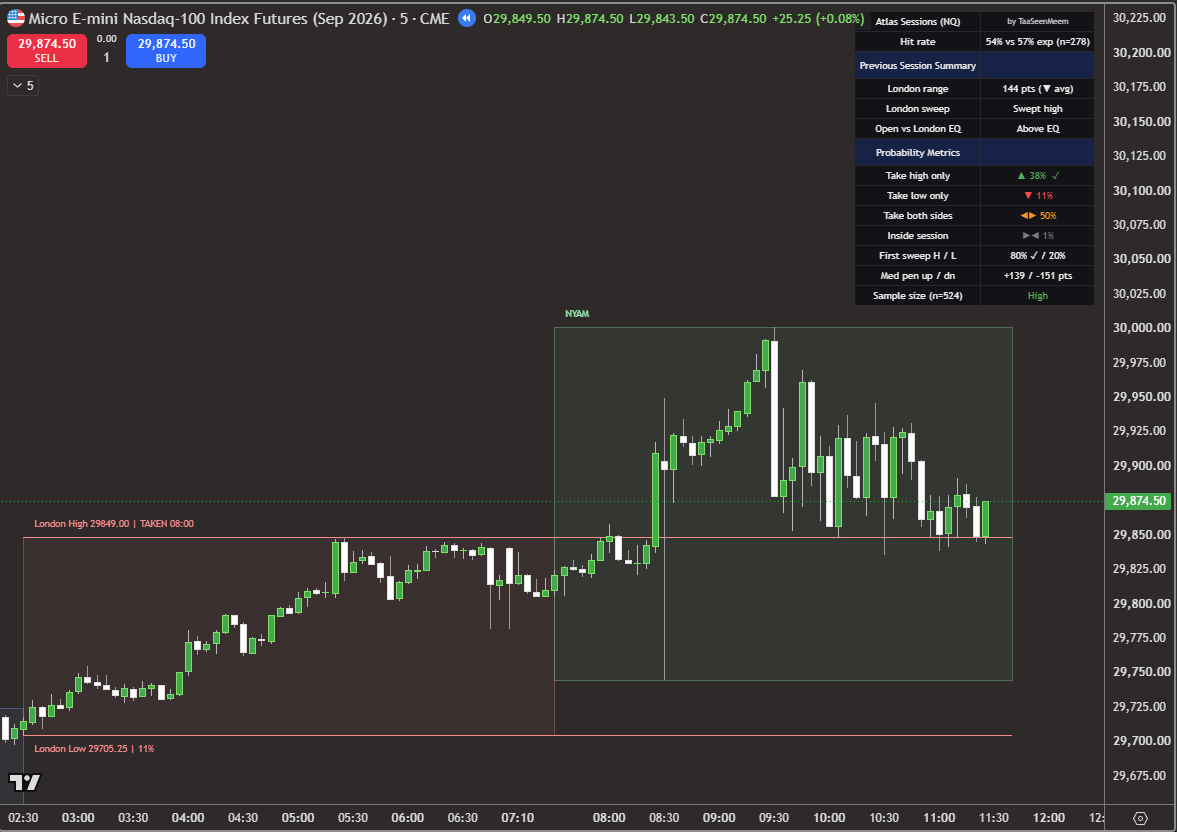
Wednesday 12 August 2026, NY AM at the close: the London high latched taken at 08:00, price running well above it before fading back, the low untouched.
11:30 close
High taken 08:00, low never approached. High only, and the 50% favourite missed again.
Wednesday 12 August

The high went early, the low was never in the conversation

First sweep ✓ · high only, against a 50% both-sides favourite

Price opened right underneath London's high with an 80% call that it would go first, and it went at 08:00. From there the session ran roughly 150 points higher, faded through the late morning and closed near where it broke out.

The low, 144 points below the high and carrying a 61% marginal, was never within reach. So both sides at 50%, the favourite for the third morning running, missed for the third morning running.

This is also the first of the week's two identical forecasts. Hold the numbers in mind: 38 / 11 / 50 / 1 with first sweep 80 / 20. Friday returns exactly the same table and does something different with it.

  • London range144 pt, below average
  • Prior sweepSwept high
  • Open vs London EQAbove EQ
  • Four-way38 / 11 / 50 / 1
  • First sweep▲ 80% · ▼ 20%
  • P(high taken)88% → taken 08:00
  • P(low taken)61% → not taken
  • Samplen 524, High
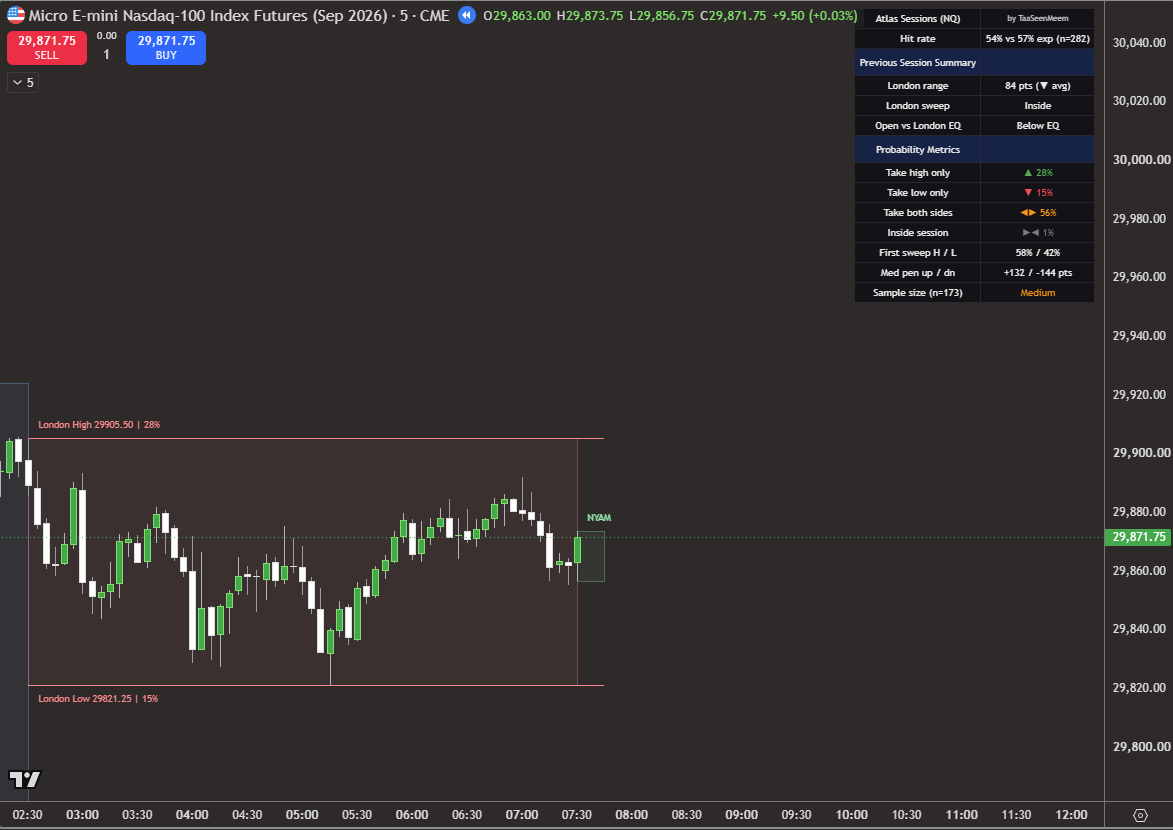
Thursday 13 August 2026, NY AM opening at 07:30 on NQ: an unusually tight London session of only 84 points with its high and low close together, both sides rated 56 percent, the highest of either week, on a medium sample of 173.
07:30 open
London high 29905.50 at 28%, low 29821.25 at 15%. An 84-point London, the tightest of either week, on the only Medium sample in twenty readings.
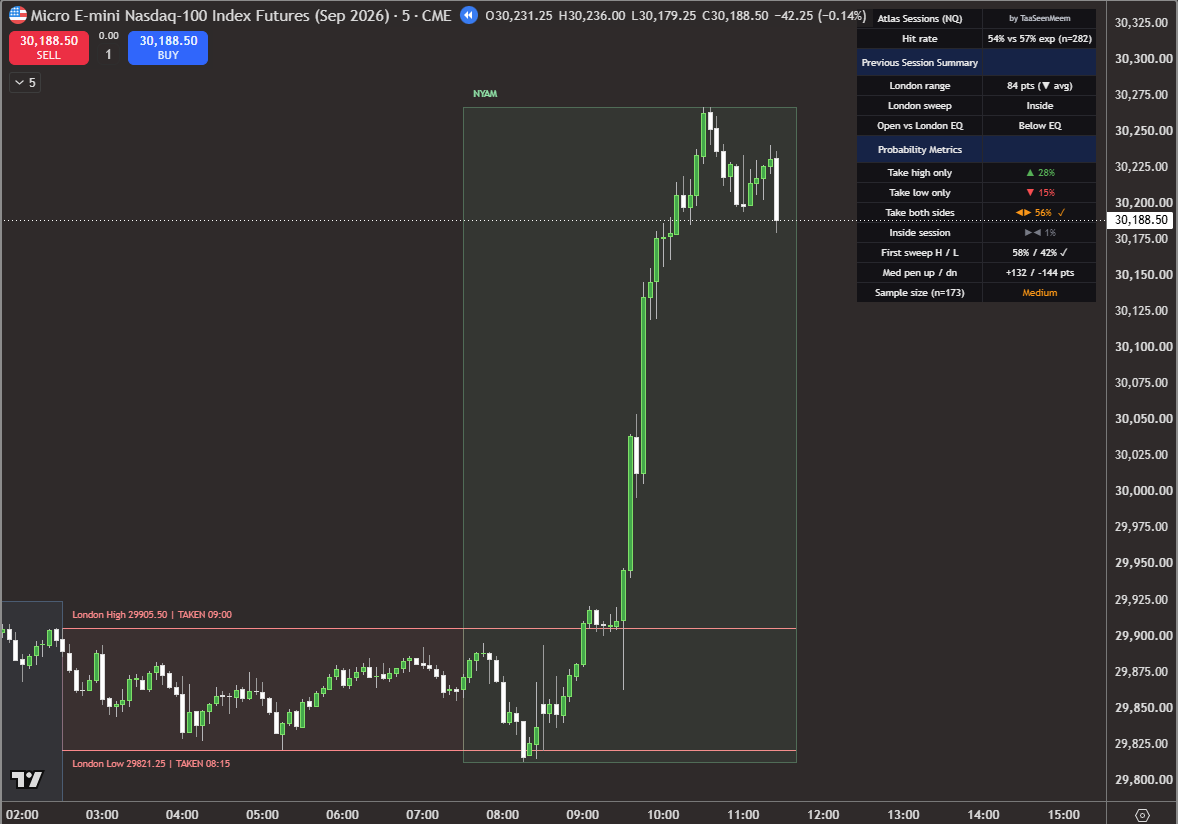
Thursday 13 August 2026, NY AM at the close: both levels taken 45 minutes apart, the low at 08:15 and the high at 09:00, followed by a run of roughly 450 points to the upside.
11:30 close
Low taken 08:15, high 09:00, then a run of roughly 450 points. Both sides, the favourite, landed.
Thursday 13 August

A tiny prior session, and the strongest both-sides call of either week

First sweep ✗ · both sides, the 56% branch ✓

London printed just 84 points, by some distance the tightest prior session across both weeks, and stayed inside its own predecessor's range. A pair of levels that close together is a pair that is hard to avoid, and the table said so with 56% on both sides, the highest both-sides share either week has produced.

It also produced the only Medium sample in twenty readings, n 173 against the 450 to 840 everywhere else. Fewer comparable sessions sit behind this forecast, and the indicator says so on its own face rather than hiding it.

Both levels went within 45 minutes, the low at 08:15 and the high at 09:00, and NY AM then ran roughly 450 points higher. The order was wrong, so axis 1 records a miss, but the branch and both sides were right.

  • London range84 pt, below average
  • Prior sweepInside
  • Open vs London EQBelow EQ
  • Four-way28 / 15 / 56 / 1
  • First sweep▲ 58% · ▼ 42%
  • P(high taken)84% → taken 09:00
  • P(low taken)71% → taken 08:15
  • Samplen 173, Medium
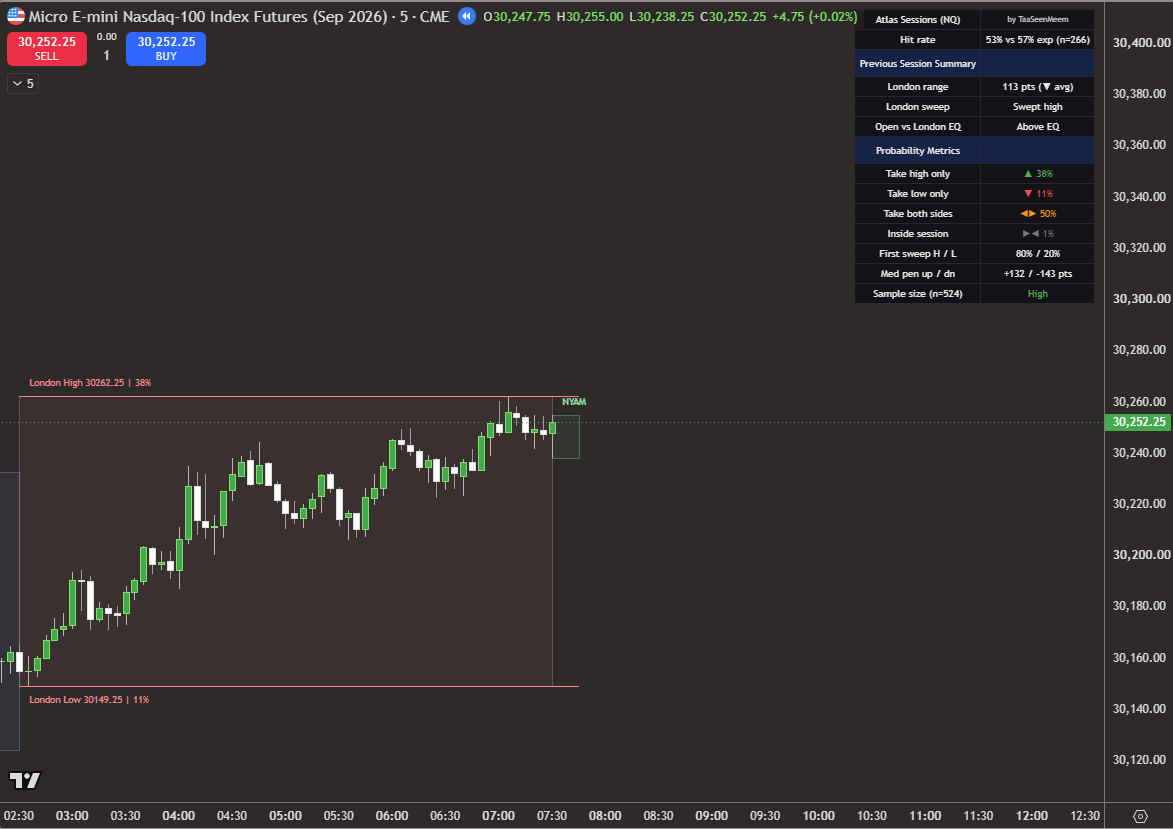
Friday 14 August 2026, NY AM opening at 07:30 on NQ: an identical status table to Wednesday, 38 percent high only, 11 percent low only, 50 percent both sides, first sweep 80 to 20.
07:30 open
London high 30262.25 at 38%, low 30149.25 at 11%. The same table as Wednesday, to the percentage point.
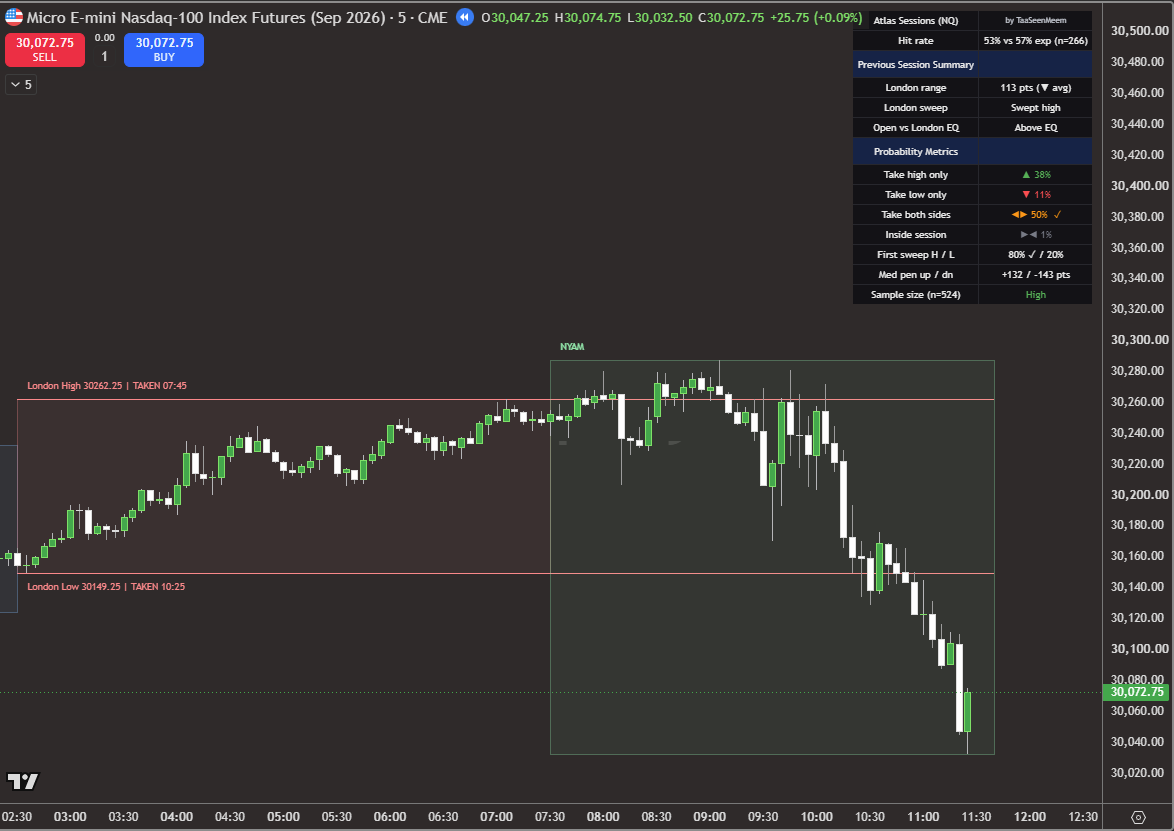
Friday 14 August 2026, NY AM at the close: the high taken at 07:45 and then, after a sharp afternoon reversal, the low taken at 10:25, so both sides went where Wednesday's identical forecast produced only the high.
11:30 close
High taken 07:45, then a reversal took the low at 10:25. Both sides, from Wednesday's identical forecast.
Friday 14 August

The same forecast as Wednesday, and a different answer

First sweep ✓ · both sides, the 50% branch ✓

Friday's table is identical to Wednesday's: 38 / 11 / 50 / 1, first sweep 80 / 20, sample n 524. Same context bin, same forecast, produced two days apart from a different London range.

The high went at 07:45, exactly as the 80% implied. Then, where Wednesday simply kept going, Friday reversed hard through the late morning, gave back the entire move and took the low at 10:25. Three from three on the day.

Two identical forecasts, one landing high only and the other both sides. That is not the model contradicting itself. That is what a 50% figure means, and it is the clearest illustration either week has produced.

  • London range113 pt, below average
  • Prior sweepSwept high
  • Open vs London EQAbove EQ
  • Four-way38 / 11 / 50 / 1
  • First sweep▲ 80% · ▼ 20%
  • P(high taken)88% → taken 07:45
  • P(low taken)61% → taken 10:25
  • Samplen 524, High
The most useful thing in either week

The same forecast, more than once

Across the ten sessions published so far, two context bins have each come up three times. Same context bin, same lookup, same numbers to the percentage point, on days weeks apart with different London ranges and different price levels.

ForecastSessionsFirst sweepOutcome
38 / 11 / 50 / 1 · sweep 80 / 20 · n 524Fri 7 Aug▲ high 80%high only
Wed 12 Aug▲ high 80%high only
Fri 14 Aug▲ high 80%both sides
34 / 25 / 41 / 0 · sweep 58 / 42 · n 528Wed 5 Aug▲ high 58%both sides
Thu 6 Aug▲ high 58%both sides
Tue 11 Aug▲ high 58%low only

Two things follow, and they matter more than this week's score.

The forecast is a lookup, not a fit. Nothing about Friday the 14th was used to produce Friday the 14th's numbers. They are the same numbers Wednesday got, and the same ones the 7th of August got, because all three sessions landed in the same measured bin. A model tuned to flatter itself would not keep handing out the same answer and then getting it wrong.

Identical forecasts resolving differently is the system working, not failing. A 50% both-sides figure that produced both sides every time would be evidence the number was wrong. Two from three is what 50% looks like at this sample size, and so is one from three. Neither settles anything; both are the point.

What this week actually shows

Four things, and the week went worse than the last one, which is exactly why it is here.

  1. The both-sides favourite lost three times in five. It was the highest-rated branch every morning and landed on Thursday and Friday only. A week is far too short to call that a calibration problem, but it is the sort of thing that would show up as one if it kept happening, which is what the running record exists to catch.
  2. The per-side view again rescues sessions the four-way score buries. Monday, Tuesday and Wednesday all score zero on axis 2 and one from two each on axis 3. Seven of ten levels resolved as their marginals implied, against a mean stated 74%. If you trade one level at a time rather than betting the branch, that is your column.
  3. The indicator flagged its own weakest forecast. Thursday came back on a sample of 173, marked Medium, against 450 to 840 on every other session across both weeks. It then produced the strongest call of the week and got it right. The point is not that it was right, it is that the sample warning was visible before the outcome was.
  4. Ten sessions still settle nothing. Twenty level events cannot confirm frequencies measured over hundreds, and the indicator's own realised versus expected row drifted from 55% to 53% against an expected 57% to 58% across the week, which is behind. Two weeks in, the honest summary is that the record has started, not that it has proved anything.
How to check this yourself. Load Atlas Sessions on your own NQ chart, set it to any timeframe you like, and scroll back to the week of 10 August 2026. The levels and percentages will be the ones printed above, because they are fixed table lookups rather than anything computed from what happened next. Compare Wednesday's table with Friday's while you are there.